
As confidentially submitted to the Securities and Exchange Commission on May 14, 2019.
This draft registration statement has not been publicly filed with the Securities and
Exchange Commission and all information herein remains strictly confidential.
Registration No. 333-
UNITED
STATES
SECURITIES AND EXCHANGE COMMISSION
Washington, D.C. 20549
FORM
S-1
REGISTRATION STATEMENT
UNDER THE SECURITIES ACT OF 1933
THE
LOVESAC COMPANY
(Exact name of registrant as specified in its
charter)
| Delaware | 5712 | 32-0514958 | ||
| (State
or other jurisdiction of incorporation or organization) |
(Primary Standard Industrial Classification Code) | (I.R.S.
Employer Identification Number) |
Two
Landmark Square, Suite 300
Stamford, Connecticut 06901
(888) 636-1223
(Address, including zip code, and telephone number, including area code, of registrant’s principal executive offices)
Shawn
Nelson
Chief Executive Officer
The Lovesac Company
Two Landmark Square, Suite 300
Stamford, Connecticut 06901
(888) 636-1223
(Name, address, including zip code, and telephone number, including area code, of agent for service)
With copies to:
| David
N. Feldman, Esq. Duane Morris LLP 1540 Broadway New York, New York 10036-4086 (212) 692-1036 |
Sidney
Burke, Esq. DLA Piper LLP (US) 1251 Avenue of the Americas New York, New York 10020-1104 (212) 335-4509 |
Approximate date of commencement of proposed sale to the public: As soon as practicable after the effective date of this registration statement.
If any of the securities being registered on this Form are to be offered on a delayed or continuous basis pursuant to Rule 415 under the Securities Act of 1933 check the following box: ☐
If this Form is filed to register additional securities for an offering pursuant to Rule 462(b) under the Securities Act, please check the following box and list the Securities Act registration statement number of the earlier effective registration statement for the same offering. ☐
If this Form is a post-effective amendment filed pursuant to Rule 462(c) under the Securities Act, check the following box and list the Securities Act registration statement number of the earlier effective registration statement for the same offering. ☐
If this Form is a post-effective amendment filed pursuant to Rule 462(d) under the Securities Act, check the following box and list the Securities Act registration statement number of the earlier effective registration statement for the same offering. ☐
Indicate by check mark whether the registrant is a large accelerated filer, an accelerated filer, a non-accelerated filer, a smaller reporting company, or an emerging growth company. See definitions of “large accelerated filer,” “accelerated filer,” “smaller reporting company,” and “emerging growth company” in Rule 12b-2 of the Exchange Act.
| Large accelerated filer | ☐ | Accelerated filer | ☐ | ||
| Non-accelerated filer | ☐ | (Do not check if a smaller reporting company) | Smaller reporting company | ☒ | |
| Emerging growth company | ☒ |
If an emerging growth company, indicate by check mark if the registrant has elected not to use the extended transition period for complying with any new or revised financial accounting standards provided to Section 7(a)(2)(B) of the Securities Act. ☐
CALCULATION OF REGISTRATION FEE
| Title of Each Class of Securities to be Registered | Amount
to be registered(1) |
Proposed
Maximum Offering Price per Share(1)(2) |
Proposed
Maximum Aggregate Offering Price(1)(2) |
Amount
of Registration Fee |
||||||||||||
| Common stock, $0.00001 par value per share | [●] | $ | [●] | $ | [●] | $ | [●] | |||||||||
| (1) | Includes [●] shares of common stock that may be sold if the underwriters’ option to purchase additional shares from certain of the selling stockholders is exercised. |
| (2) | Estimated solely for the purpose of calculating the registration fee pursuant to Rule 457(c) under the Securities Act of 1933, as amended, based on the average of the high and low prices of the registrant’s common stock as reported on Nasdaq on [●], 2019. |
The Registrant hereby amends this registration statement on such date or dates as may be necessary to delay its effective date until the Registrant shall file a further amendment which specifically states that this registration statement shall thereafter become effective in accordance with Section 8(a) of the Securities Act of 1933, as amended, or until the registration statement shall become effective on such date as the Securities and Exchange Commission, acting pursuant to said Section 8(a), may determine.
The information in this preliminary prospectus is not complete and may be changed. We may not sell these securities until the registration statement filed with the Securities and Exchange Commission is effective. This preliminary prospectus is not an offer to sell these securities and it is not soliciting an offer to buy these securities in any state or other jurisdiction where the offer or sale is not permitted.
Subject to completion, dated [●], 2019
PRELIMINARY PROSPECTUS
[●] Shares
The Lovesac Company
Common Stock
We are offering [●] shares of our common stock and the selling stockholders named in this prospectus are offering [●] shares of our common stock. We will not receive any proceeds from the sale of our common stock by the selling stockholders.
Our Common Stock is listed on the Nasdaq Global Market (“Nasdaq”) under the symbol “LOVE.” On [●], 2019, the last reported sale price of our common stock on Nasdaq was $[●].
We are an “emerging growth company” as defined in the Jumpstart Our Business Startups Act of 2012 and, as such, have elected to comply with certain reduced public company disclosure standards. See “Prospectus Summary — Implications of Being an Emerging Growth Company.”
Investing in our securities involves a high degree of risk. See the section entitled “Risk Factors” starting on page [14] of this prospectus and elsewhere in this prospectus for information that should be considered in connection with an investment in our securities.
Neither the Securities and Exchange Commission nor any state securities commission has approved or disapproved of these securities or passed upon the adequacy or accuracy of this prospectus. Any representation to the contrary is a criminal offense.
| Per Share | Total | |||||||
| Public offering price | $ | $ | ||||||
| Underwriting discounts and commissions (1) | $ | $ | ||||||
| Proceeds, before expenses, to us | $ | $ | ||||||
| Proceeds, before expenses, to the selling stockholders | $ | $ | ||||||
| (1) | See “Underwriting” for additional information regarding underwriting compensation. |
Certain of the selling stockholders have granted the underwriters an option for a period of 30 days to purchase up to an additional [●] shares of common stock.
Delivery of the shares is expected to be made to the purchasers on or about [●], 2019.
Sole Book-Running Manager
| Stifel |
The date of this prospectus is [●], 2019


You should rely only on the information contained in this prospectus or in any free writing prospectus that we may specifically authorize to be delivered or made available to you. Neither we, the selling stockholders, nor the underwriters have authorized anyone to provide you with any information other than that contained in this prospectus or in any free writing prospectus we may authorize to be delivered or made available to you. We take no responsibility for, and can provide no assurance as to the reliability of, any other information that others may give you. We and the selling stockholders are offering to sell, and seeking offers to buy, shares of our common stock only in jurisdictions where offers and sales are permitted. The information in this prospectus is accurate only as of the date of this prospectus, regardless of the time of delivery of this prospectus or any sale of securities. Our business, financial condition, results of operations and prospects may have changed since that date.
For investors outside the United States: No action has been taken that would permit this offering or possession or distribution of this prospectus in any jurisdiction where action for that purpose is required, other than in the United States. Persons outside the United States who come into possession of this prospectus must inform themselves about, and observe any restrictions relating to, the offering of securities and the distribution of this prospectus outside the United States.
As used in this prospectus, the terms “we”, “us”, “our”, “our Company”, “the Company” and “Lovesac” refer to The Lovesac Company and our predecessor entities, as applicable, unless the context clearly indicates otherwise.
We do not have a calendar year end fiscal year. We use a 52 or 53-week fiscal year ending on the Sunday closest to February 1st. Fiscal years are identified in this prospectus according to the calendar year in which they end. For example, references to “fiscal 2019” or “fiscal year 2019” or similar references refer to the fiscal year ended February 3, 2019, and “fiscal 2018” or “fiscal year 2018” or similar references refer to the fiscal year ended February 4, 2018. Alternatively, references to “2019”, “2018” and “2017” refer to the calendar years ending or ended December 31, 2019, 2018 and 2017, respectively.
In this prospectus, unless otherwise specified, all references to “common stock” refer to shares of our common stock.
i
Trademarks, Trade Names and Service Marks
We own various U.S. federal trademark registrations and applications, certain foreign trademark registrations and applications, and unregistered trademarks, including the following marks referred to in this prospectus: Lovesac®, Lovesoft®, Sactionals®, Durafoam®, SAC® and Designed For Life®. All other trademarks or trade names referred to in this prospectus are the property of their respective owners. Solely for convenience, the trademarks and trade names in this prospectus are referred to without the symbols ® and ™, but such references are not intended to indicate that we or their respective owners will not assert, to the fullest extent possible under applicable law, our or their rights thereto.
Market, Industry and Other Data
Unless otherwise indicated, information contained in this prospectus concerning our industry and the markets in which we operate, including our general expectations and market position, market opportunity and market size, is based on reports from various third-party sources. We believe this information to be reasonable based on the information available to us as of the date of this prospectus. However, we have not independently verified market and industry data from third-party sources. Because this information involves a number of assumptions and limitations, you are cautioned not to give undue weight to such information. The content of the sources, except to the extent specifically set forth in this prospectus, does not constitute a portion of this prospectus and is not incorporated herein.
In addition, projections, assumptions and estimates of our future performance and the future performance of the industry in which we operate are necessarily subject to a high degree of uncertainty and risk due to a variety of factors, including those discussed under the sections entitled “Cautionary Note Regarding Forward-Looking Statements” and “Risk Factors” in this prospectus. These and other factors could cause results to differ materially from those expressed in the estimates made by third parties and by us.
ii
This summary highlights certain information contained in other parts of this prospectus. Because it is a summary, it does not contain all of the information you should consider before investing in shares of our common stock. You should read the entire prospectus carefully, including “Risk Factors,” “Cautionary Note Regarding Forward-Looking Statements,” “Management’s Discussion and Analysis of Financial Condition and Results of Operations,” and the financial statements and related notes included in this prospectus before deciding to invest in our common stock.
Our Business
We are a technology driven, omni-channel company that designs, manufactures and sells unique, high quality furniture comprised of modular couches called Sactionals and premium foam beanbag chairs called Sacs. We market and sell our products through modern and efficient showrooms and, increasingly, through online sales. We believe that our ecommerce centric approach, coupled with our ability to deliver our large upholstered products through nationwide express couriers, is unique to the furniture industry.
The name “Lovesac” was derived from our original innovative product, a premium foam beanbag chair, the Sac. The Sac was developed in 1995 and provided the foundation for the Company. Sales of this product have been increasing, representing $41.2 million for fiscal 2019, as compared to $26.9 million for fiscal 2018. We believe that the large size, comfortable foam filling and irreverent branding of our Sacs products have been instrumental in growing a loyal customer base and our positive, fun image.
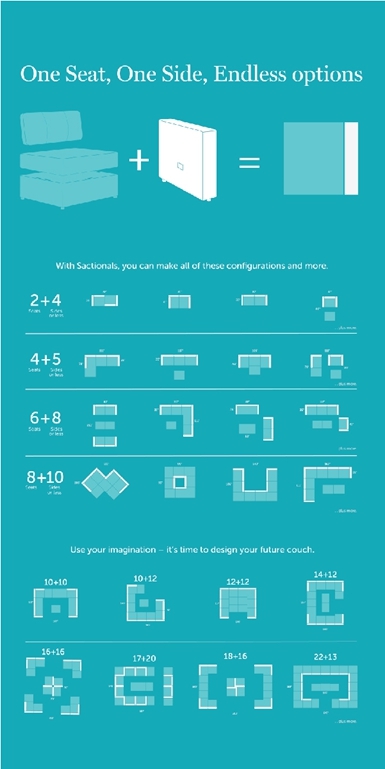
Our Sactionals product line currently represents a majority of our sales. Sactionals are a couch system that consists of two components, seats and sides, which can be arranged, rearranged and expanded into thousands of configurations easily and without tools. Our Sactional products include a number of patented features relating to their geometry and modularity, coupling mechanisms and other features. Our Sactionals represented 72.5% of our sales for fiscal 2019 (or $120.2 million) as compared to 71.3% of sales for fiscal 2018 (or $72.6 million). We believe that these high quality premium priced products enhance our brand image and customer loyalty and expect them to continue to garner a significant share of our sales.
Sacs and Sactionals come in a wide variety of colors and fabrics that allow consumers to customize their purchases in numerous configurations and styles. We provide lifetime warranties on our Sactionals frames and the foam used in both product lines, and 3-year warranties on our covers. Our Designed for Life trademark reflects our dynamic product line that is built to last and evolve throughout a customer’s life. Customers can continually update their Sacs and Sactionals with new covers, additions and configurations to accommodate changes in their family and housing situations.
We believe that our products complement one another and have generated a loyal customer base, evidenced by our recent estimate that 38% of our transactions in fiscal 2019 were from repeat customers. We believe the strength of our brand is reflected in the number of customers who routinely share their purchases of Lovesac products with their friends through social media, often displaying our logos or company name in their posts. Our customers include celebrities and other influencers who support our brand through postings made on an uncompensated and unsolicited basis. As of [●], 2019, we had approximately [●] followers on Facebook and [●] followers on Instagram.
We currently market and sell our products in over 75 showrooms at top tier malls, lifestyle centers and street locations in 30 states in the United States. Our modern, efficient showrooms are designed to appeal to millennials and other purchasers looking for comfortable, enduring, premium furniture. They showcase the different sizes of our Sacs, the myriad forms into which our Sactionals can be configured, and the large variety of fabrics that can be used to cover our products. Our retail showrooms are technology driven and focused on educating prospective customers about the many benefits of our unique products, enabling us to require just 506 to 1,350 square feet for each showroom.
As part of our direct to consumer sales approach, we also sell our products through our fast growing ecommerce platform. We believe our products are uniquely suited to this channel. Our foam-based Sacs can be reduced to one-eighth of their normal size and each of our Sactionals components weighs less than 50 pounds upon shipping. With furniture especially suited to ecommerce applications, our sales completed through this channel accounted for 19.9% of our total sales for fiscal 2019, up from 18.5% for fiscal 2018. Our showrooms and other direct advertising and marketing efforts work in concert to drive customer conversion in ecommerce.
1
Despite the increase in sales of both our Sacs and Sactionals, net losses were $6.7 million for fiscal 2019 and $5.5 million for fiscal 2018, primarily due to increased spending on showrooms, advertising, marketing and financing related costs.
Product Overview
We challenge the notion that a piece of furniture is static by offering a dynamic product line built to last and evolve throughout a customer’s life. Our products serve as a set of building blocks that can be rearranged, restyled and re-upholstered with any new setting, mitigating constant changes in fashion and style.
| ● | Sactionals. We believe our Sactionals platform is unlike competing products in its adaptability yet is comparable aesthetically to similarly priced premium couches and sectionals. Our Sactional products include a number of patented features relating to their geometry and modularity, coupling mechanisms and other features. Utilizing only two, standardized pieces, “seats” and “sides,” and over 250 high quality, tight-fitting covers that are removable, washable, and changeable, customers can create numerous permutations of a sectional couch with minimal effort. Customization is further enhanced with our specialty-shaped modular offerings, such as our wedge seat and roll arm side. Our custom features and accessories can be added easily and quickly to a Sactional to meet endless design, style and utility preferences, reflecting our Designed for Life philosophy. Sactionals are built to meet the highest durability and structural standards applicable to fixed couches. Sactionals are comprised of standardized units and we guarantee their compatibility over time, which we believe is a major pillar of their value proposition to the consumer. |
| ● | Sacs. We believe that our Sacs product line is a category leader in oversized beanbags. The Sac product line offers 6 different sizes ranging from 22 pounds to 95 pounds with capacity to seat 3+ people on the larger model Sacs. Filled with Durafoam, a blend of shredded foam, Sacs provide serene comfort and guaranteed durability. Their removable covers are machine washable and may be easily replaced with a wide selection of cover offerings. |
| ● | Accessories. Our accessories complement our Sacs and Sactionals by increasing their adaptability to meet evolving consumer demands and preferences. Our current product line offers Sactional-specific drink holders, footsac blankets, decorative pillows, fitted seat tables and ottomans in varying styles and finishes, providing our customers with the flexibility to customize their furnishings with decorative and practical add-ons to meet evolving style preferences. We are in the process of developing additional accessories for the tech-savvy consumer. |
Sales Channels
We offer our products through an omni-channel platform that provides a seamless and meaningful experience to our customers online and in-store. Compared to traditional retailers, our showrooms require significantly less square footage because of our need to have only a few in-store sample configurations for display and our ability to stack our inventory for immediate sale. Our retail showrooms are technology driven and focused on educating prospective customers about the many benefits of our unique products, enabling us to require just 506 to 1,350 square feet for each showroom. The small footprint requirement provides a cost advantage and flexibility in locating our showrooms strategically in A-rated malls and street locations in our target markets. These logistical advantages underlie our broader tech-driven, internet-based business model, where we leverage our showrooms as both a traditional retail channel to purchase our products and an educational center for prospective online customers to learn about and interact with our products in real time.
2
Through our fast growing mobile and ecommerce channel, we are able to significantly enhance the consumer shopping experience for home furnishings, driving deeper brand engagement and loyalty, while simultaneously driving favorable margin expansion. Our technology capabilities are robust, and we are well positioned to benefit from the growing consumer preference to transact via mobile devices. We leverage our strong social media presence and showroom footprint to drive traffic toward our ecommerce platform, where product testimonials and inspirational stories from our Lovesac community create a more engaging consumer experience for our customers. Additionally, our products’ compact packaging facilitates consistent production scheduling, outsourcing of delivery and lower shipping costs, allowing us to quickly and cost-effectively deliver online orders.
We have also enhanced our sales through the use of shop in shops. We have an ongoing working relationship with Costco to operate shop in shop showrooms that typically average ten days at a time. The shop in shop showrooms display select Sacs and Sactionals and are staffed with associates trained to demonstrate and sell our products. We continue to explore other shop in shop partnerships and opportunities to promote our products and facilitate customers interacting with our products in the real world. Other sales which includes shop in shop sales represented approximately 11.9% of sales in fiscal 2019, as compared to 5.0% for fiscal 2018.
Current and Target Customers
We believe there is significant overlap in the profiles of our current customers and our target customers. Our target customer earns a household income of at least $100,000, is between the ages of 24 and 45, is married and currently has or plans to form a household. While we seek to market our products to this target customer broadly, we especially target millennials (who we define as those persons born between 1983 and 2000) because we believe they desire the branding, transparent business practices, innovative solutions and convenience of the on-demand commerce we offer. Millennial heads of household represent approximately 19% of our customer base (based on internal sampling we conducted with one of our products), and we expect them to become a larger portion of our customer base. We believe our culture of innovation, superior product development capabilities and integrated omni-channel infrastructure enable us to offer our customers a value proposition superior to our competitors.
Our Market
Large and Growing Furniture Retailing Industry
We sell our products in the large and highly fragmented furniture retailing industry, which has been rebounding steadily since the global recession. According to Mintel, a market research firm, consumer furniture expenditures are expected to grow to $127.5 billion in 2021, representing an average annual growth rate of 3.4% between 2016 and 2021. Additionally, Mintel reported that the segment consisting of couches, chairs, and other seating products comprised nearly 30% of all U.S. consumer furniture expenditures in 2015, surpassing the next largest segment, mattresses and sleep equipment, which represented 17% of expenditures.
A Maturing Millennial Population with Favorable Furniture Purchasing Habits
Millennials, our target demographic, have surpassed Baby Boomers (persons generally born between 1946 and 1964) as the largest living generation in the United States. The millennial population reached 83.1 million people in 2015, representing more than 25% of the U.S. population according to data from the U.S. Census Bureau. Moreover, tech savvy millennials are maturing to an age where their buying power coincides with larger discretionary purchases, including furniture products. Based on a survey conducted by Mintel, 73% of millennials (who Mintel defines as those persons born between 1977 and 1994) purchased furniture between April 2014 and April 2016. According to Mintel, of those purchasing furniture between April 2014 and April 2016, 47% of millennials reported that they had made the purchase online, compared to just 26% for Generation X and 17% for Baby Boomers purchasing furniture during the same period.
3
Emergence of Online Sales in the Furniture Industry
According to eMarketer, a market research company that provides insights and trends related to digital marketing, media and commerce, retail ecommerce sales of furniture and home furnishings will grow from $36.0 billion in 2017 to $62.4 billion in 2021. In addition, over one-third of furniture consumers have purchased products online, and this percentage is expected to continue to expand, according to Mintel. Driving the market share growth of the online segment are retailers that offer fully supported shopping experiences across their web and mobile platforms. When purchasing their most recent home furnishing product, 30% of consumers made an online purchase using a computer and 9% of consumers made an online purchase using a mobile device according to data from Mintel. While consumers are now more tech savvy and likely to browse for furniture products online, many consumers still prefer to see and feel products in-store before making their purchasing decision. Omni-channel retailers that offer a comprehensive shopping experience across all channels are well positioned to attract the growing portion of consumers who use multiple channels to browse, compare and purchase furniture products.
Our Competitive Strengths
Our consumers often cross-shop Lovesac with companies such as Crate and Barrel, Pottery Barn, Arhaus, Restoration Hardware, Ikea, Joybird and Wayfair. We believe that the following strengths are central to the power of our brand and business model:
Innovative Business Model
| ● | Merchandising Strategy. Many home furnishings retailers, online or offline, rely on an assortment of new offerings each season to drive their business and to refashion their offerings. We have avoided this “merchandising” approach in favor of a product platform-based approach that reduces the need for seasonal introductions, designer collections, or broad in-stock assortments. We optimize our in-stock assortment of covers and accessories by limiting them to those that sell in large quantity and therefore present lower risk. We also provide a broad assortment of made-to-order items, which we manufacture after the consumer has purchased and paid for them. This business model yields little to no surplus inventory, less margin erosion due to overstock write-downs, higher than average annual inventory turns, increased focus at the showroom management level, and simplicity in merchandising-display execution. |
| ● | Product Platform Approach. We have two primary platforms upon which we develop, manufacture and sell our fundamental Sacs and Sactionals products. We market our product platforms as a long term investment that our customers can continually update with new arrangements, coverings and accessories. In turn, these changes and updates provide a recurring revenue source for our business. In addition, our Sactionals platform is an environmentally conscious alternative to fixed couches that tend to be discarded when they go out of style or wear out, a by-product of our Designed for Life approach and an important feature to some consumers. |
| ● | Ecommerce Focus.We build our business processes, systems, compensation structures, and logistical models with an ecommerce-first approach. We continually innovate to make shopping online easier for our customers, and we use social media to drive increased traffic to our web-based sales applications. From a product standpoint, the open-cell nature of the Durafoam filler in our Sacs allows them to be compressed for shipping to one-eighth of their normal size. To facilitate shipping, Sactionals seat cushions and back pillows are compressed to fit inside an otherwise hollow hardwood upholstered seat frame. |
| ● | A Culture of Innovation. From inception, we have focused on developing unique, innovative and proprietary product platforms. We are continuously expanding and introducing new extensions to these platforms to broaden the appeal and grow the addressable market of our product offerings. We continually evaluate new products to complement our Sactionals and Sac lines and are currently developing accessories for the tech-savvy consumer. We have 17 issued U.S. utility patents and 21 issued foreign utility patents, 7 pending U.S. utility patent applications and 36 pending foreign utility patent applications. We expect to file U.S. and foreign patent applications for future innovations. We believe that our patent portfolio, combined with our innovative design approach may deter others from attempting to imitate or replicate our products. |
4
Strong Brand Loyalty
We believe our brand, products, and Designed for Life philosophy encourage people to share their stories and develop a personal relationship with Lovesac and its community. We foster these interactions through active direct engagement using several social media platforms. These are products that move, change and rearrange. They are soft, comfortable and fun to jump on. We believe that all of this causes our customers to uniquely serve as active ambassadors, providing organic public relations, word of mouth advertising, and customer testimonials and endorsements. In addition, our customers have a high repeat purchasing rate and high expected lifetime engagement.
| ● | High Repeat Purchasing Rates. We believe our focus on customer interaction and data driven analysis of their behavior and projected needs, drives our high customer repeat rates. Our repeat customers accounted for 38% of all transactions in fiscal 2019 and 39% in fiscal 2018. We expect new transactions to continue to become a larger portion of our transaction mix as we spend on customer acquisition. |
| ● | Robust Customer Lifetime Value. Once customers invest in our products, they tend to stay with them, grow with them, and add to them. We believe our customers’ loyalty is an important driver of our Customer Lifetime Value (“CLV”). An example of this is that our fiscal 2015 cohort has increased its CLV by 19.3% since year end fiscal 2015. We calculated our fiscal 2015 CLV by dividing the aggregate gross profits through fiscal 2019 attributable to the 2015 cohort (approximately $41,147,646) by the total number of customers in the 2015 cohort (38,423 customers). |
Omni-Channel Approach
Our distribution strategy allows us to reach customers through three distinct, brand-enhancing channels, which we refer to as our omni-channel approach.
| ● | Ecommerce. Through our mobile and ecommerce channel, we believe we are able to significantly enhance the consumer shopping experience, driving deeper brand engagement and loyalty, while also realizing margins that are more favorable than our showroom locations. We believe our robust technological capabilities position us well to benefit from the growing consumer preference to transact at home and via mobile devices. |
| ● | Showrooms. We carefully select the best small-footprint retail locations in high-end malls and lifestyle centers for our showrooms. The architecture and layout of these showrooms is designed to communicate our brand personality and key product features. Our goal is to educate first-time customers, creating an environment where people can touch, feel, read, and understand the technology behind our products. We are updating and remodeling many of our showrooms to reflect our new showroom concept, which emphasizes our unique product platform, and will be the standard for future showrooms. Our new showroom concept, introduced in 2016, utilizes technology in more experiential ways to increase traffic and sales. |
| ● | Shop in Shops. We are expanding the use of lower cost shop in shops to increase the number of locations where customers can experience and purchase our products. We have an ongoing working relationship with Costco to operate shop in shop programs, or “roadshows,” that usually run for 10 days at a time. These shop in shops are staffed similarly to our showrooms with associates trained to demonstrate and sell our products and promote our brand. We also believe our shop in shops provide a low cost alternative to drive brand awareness, in store sales, and ecommerce sales. |
5
Strong Millennial Appeal
We have targeted the millennial generation because we believe they desire branded products, coupled with transparent business practices, innovative solutions and the convenience of on-demand commerce. Additionally, members of the millennial generation, currently the most populous age group in the United States, are completing their educations, getting married, and starting or expanding their households. The peak ages for home furnishings purchases are 35-54. We believe that home furnishings will thrive as millennials and their children need larger residences and the necessary furnishings for household and family formation. The modularity of our Sactionals and ease of cleaning and replacing covers on Sactionals and Sacs provide our customers who are moving and expanding their households with the ability to evolve their purchases to accommodate the changes in their family and housing situations, offering us a competitive advantage.
Unique Distribution Capability
Due to the unique modularity of our Sactionals products and the shrinkability of our Sacs, we are able to distribute our products through nationwide express couriers and efficiently utilize warehouse space and international shipping routes. We believe our Sactionals are the only products in their category that enjoy this logistical advantage.
Seasoned Management Team
Our management team is led by our CEO and founder, Shawn Nelson, who continues to focus on developing new products and intellectual property to drive future growth. Our President and Chief Operating Officer, Jack Krause, has significant experience in and a deep understanding of the complexities in managing high-growth brands. Since joining Lovesac, he has been instrumental in guiding the company from a retail-led business model to an omni-channel direct-marketing driven business model. Our Executive Vice President and Chief Financial Officer, Donna Dellomo, is a Certified Public Accountant and possesses significant experience and knowledge regarding public company accounting and reporting. Prior to joining our Company, for 19 years, Ms. Dellomo served as Vice President and Chief Financial Officer of a publicly traded fragrance retailer with over 290 retail locations and a wholesale distribution network. David Jensen has served as our Chief Technology/Chief Information Officer since joining Lovesac in 2018 to lead our technology team as we evolve into a more marketing-driven digital-first retailer. Prior to joining our Company, Mr. Jensen served as the Senior Director of Information Services at the retailer J. Jill.
Our Growth Strategies
In order to position Lovesac for future growth, in the last several years we made significant investments in overhead, optimized and integrated our business technologies and processes, and further developed our marketing tactics. In addition, we have refocused our strategy regarding our showrooms, moving to higher end malls, lifestyle centers and street locations, to support digital sales, our primary growth channel. Finally, we have committed to a new showroom design creating a much more interactive, technology driven experience that has resulted in higher traffic levels and conversion than previous showroom models.
These long-term initiatives have required a significant amount of management’s attention, which has shifted management’s focus away from short-term sales growth. As a result of these efforts, along with the implementation of the strategies noted below, we believe Lovesac is poised for meaningful sales growth. Our goal is to further improve our leadership in the home furnishings market by pursuing the following key strategies:
Continue to Build on Our Brand
Despite our loyal following, we believe there is a significant opportunity to increase our brand awareness. Based on our own internal study that was concluded in April 2017, we estimate that our brand awareness is less than 1% among all consumers nationally. Before 2017, we invested minimally in advertising. Since then, we have aggressively invested in brand building and direct marketing efforts, including direct mail, 30-second television commercials in select markets and social media. Our focus on building the Lovesac and Sactional brands has led to an increase in our new Sactional customer base, which grew by 55.8% in fiscal 2019. We plan to accelerate our ecommerce sales by building awareness via increased digital and social media, including digital videos and direct response television.
Update Showrooms and Add Other Locations
We intend to continue to renovate our current showroom locations, open new showrooms across the country in lifestyle centers, top tier shopping malls, and high street and urban locations, and expand product touch-feel points through the increased use of shop in shop locations. Because of their small size and above average productivity, we believe our approach to our showrooms creates a compelling opportunity to open more showrooms in a wide variety of retail spaces across North America.
| ● | Showrooms. In our showrooms, we focus on offering potential customers the opportunity to experience the considerable flexibility they have in selecting fabrics and configurations. We have evolved our model for new showrooms and are renovating our existing showrooms to reflect the standards of our new model. Our new showroom concept utilizes technology in more experiential ways to increase traffic and sales and communicate our brand personality and key product features. To attract customer traffic, our new model features two giant LED screens embedded in the walls that play videos demonstrating the Sactionals technology in motion. The entire architecture and layout of these new showrooms have been redesigned to communicate the brand personality and key product features, with the goal to educate first-time customers and create a self-service environment where people can touch, feel, read, and understand the technology behind our products. LED screens on the walls and iPads in the hands of the staff enhance what we believe is a “virtually merchandised” showroom in a very small footprint. In connection with these renovations, we have experienced increased sales and negotiated more favorable lease terms. |
6
| ● | Shop in Shops. We have an ongoing working relationship with Costco to operate shop in shop showrooms. We have been expanding the use of these shop in shop showrooms, and plan to seek other partners to operate similar concept showrooms, to increase the number of locations where customers can experience and purchase our products at a lower cost to us than our permanent showrooms. |
Increase Sales and Operating Margins
We seek to increase sales and operating margins through our premium pricing strategy and omni-channel platform, which we believe will require relatively small near term increases in fixed overhead.
| ● | Premium Pricing. Lovesac’s products are positioned in the premium couch segment of the furniture market. We market as premium products because of our foam fillings, higher quality materials and unique modularity requiring a distinct level of manufacturing capability. At our price point, we offer a unique value proposition that combines both beautiful aesthetics and utility to our customers that we believe our competitors cannot offer. Additionally, our high end branding strategy, further enhanced by our unsolicited celebrity endorsements and large social media following, commands premium pricing, as we feel lowering prices may negatively affect perception of our products. We believe that our pricing and higher upfront costs are also justified by our platform approach, where once a customer buys their first couch, the cost of expanding and adding to it over time is much less expensive than the traditional method of purchasing another new couch to replace the old one. Further, we believe that as we grow sales, we will be able to spread them over relatively fixed overhead and increase our margins. |
| ● | Omni-Channel Platform. By leveraging our omni-channel platform, we cost-effectively drive traffic to our ecommerce channel, resulting in increased web-based sales and improved operating margins. We continually seek to improve our ecommerce capabilities to drive sales and take advantage of the lower cost of this channel. Our showrooms and other direct marketing efforts work in concert to drive customer conversion in ecommerce. In addition, our shop in shops provide a low cost alternative to drive brand awareness and both in-store and ecommerce sales. |
Summary Risk Factors
Investing in our common stock involves substantial risk, and our business is subject to numerous risks and uncertainties, including those listed in the section entitled “Risk Factors” and elsewhere in this prospectus. These risks include, among other things:
| ● | our ability to achieve or sustain profitability; | |
| ● | our ability to sustain our recent growth rates; | |
| ● | our dependence on foreign manufacturing and imports for our products; | |
| ● | our ability to raise capital; |
| ● |
our ability to implement and maintain effective internal control over our financial reporting; | |
| ● |
our ability to accurately report our financial results, prevent fraud or file our periodic reports in a timely manner if our internal control over financial reporting or disclosure controls and procedures are not effective; | |
| ● | our ability to accurately forecast our operating results and growth rate; |
7
| ● | our ability to manage our growth effectively; | |
| ● | our ability to maintain our brand image, engage new and existing customers and gain market share; | |
| ● | our ability to acquire new customers or do so in a cost-effective manner; | |
| ● | our ability to compete successfully; |
| ● | our ability to effectively market our products and increase customer traffic; |
| ● | our ability to management reputational risks associated with the use of social media; and |
| ● | our ability to launch new products. |
Recent Reorganization and IPO
The Company was formed in the State of Delaware on January 3, 2017, in connection with a corporate reorganization with SAC Acquisition LLC, a Delaware limited liability company, the predecessor entity to the Company and currently the largest stockholder of the Company. Our common stock began trading on Nasdaq under the symbol “LOVE” on June 27, 2018, and we consummated our initial public offering (“IPO”) of 4,025,000 shares of our common stock on June 29, 2018, at a public offering price of $16.00 per share.
Wells Fargo Credit Facility
In the beginning of fiscal 2019, we entered into a five-year, secured revolving credit facility with Wells Fargo Bank, National Association (“Wells”). The credit facility with Wells permits borrowings of up to $25.0 million, subject to borrowing base and availability restrictions. For additional information regarding our line of credit with Wells, see Note 9 to our consolidated financial statements for the fiscal years ended February 3, 2019 and February 4, 2018.
Corporate Information
The Company’s principal executive office is Two Landmark Square, Suite 300, Stamford, CT 06901. Our telephone number is 888-636-1223. Our Internet address is www.lovesac.com. We do not incorporate the information on or accessible through our website into this prospectus, and you should not consider any information on, or that can be accessed through, our website a part of this prospectus.
Our Equity Sponsor
We have a valuable relationship with our equity sponsor, Mistral, which, through funds and investment vehicles advised by Mistral, has made significant equity investments in us, including a controlling interest in our principal stockholder, SAC Acquisition LLC. We believe that we will continue to benefit from Mistral’s investment experience in the consumer products sector, its expertise in effecting transactions and its support for our near-term and long term strategic initiatives.
Upon completion of this offering, assuming an offering size as set forth in “Summary of the Offering”, Mistral, through its controlling interest of SAC Acquisition LLC and the common stock held by investment vehicles affiliated with Mistral, will control approximately [●]% of our common stock (or [●]% if the underwriters’ option to purchase additional shares is exercised in full) and will therefore be able to significantly influence all matters that require approval by our stockholders, including the election and removal of directors, changes to our organizational documents and approval of acquisition offers and other significant corporate transactions.
8
Mistral’s continuing significant stock ownership and influence, even after its contemplated sale of shares in this offering, may give rise to actual or perceived conflicts of interest with holders of our common stock. Mistral’s significant ownership in us and its resulting ability to influence us may discourage a third party from making a significant equity investment in us or a transaction involving a change of control, including transactions in which holders of shares of our common stock might otherwise receive a premium for such holders’ shares over the then-current market price. See “Risk Factors- Risks Related to this Offering and Ownership of Our Common Stock” for a summary of the potential conflicts of interest that may arise as a result of Mistral’s continuing significant stock ownership.
Implications of Being an Emerging Growth Company
The Jumpstart Our Business Startups Act (the “JOBS Act”), was enacted in April 2012 with the intention of encouraging capital formation in the United States and reducing the regulatory burden on newly public companies that qualify as “emerging growth companies.” We are an emerging growth company within the meaning of the JOBS Act. As an emerging growth company, we may take advantage of exemptions from various public reporting requirements, including the requirement that our internal control over financial reporting be audited by our independent registered public accounting firm pursuant to Section 404 of the Sarbanes-Oxley Act of 2002 (“SOX”), requirements related to compliance with new or revised accounting standards, requirements related to the disclosure of executive compensation in this prospectus and in our periodic reports and proxy statements, and the requirement that we hold a nonbinding advisory vote on executive compensation and any golden parachute payments. We may take advantage of these exemptions until we are no longer an emerging growth company.
In addition, Section 107 of the JOBS Act provides that an emerging growth company can take advantage of the extended transition period provided in Section 7(a)(2)(B) of the Securities Act of 1933, as amended, for complying with new or revised accounting standards. As a result, an emerging growth company can delay the adoption of certain accounting standards until those standards would otherwise apply to private companies. We have elected to take advantage of this extended transition period.
We will remain an emerging growth company until the earliest to occur of (i) the last day of the fiscal year in which we have $1.07 billion or more in annual revenue; (ii) the date we qualify as a “large accelerated filer” with at least $700 million of equity securities held by non-affiliates; (iii) the date on which we have issued, in any three-year period, more than $1.0 billion in non-convertible debt securities; or (iv) the last day of the fiscal year ending after the fifth anniversary of our IPO.
Summary of the Offering
| Common stock offered by us | [●] shares | |
| Common stock offered by selling stockholders | [●] shares (or [●] shares if the underwriters exercise their option to purchase additional shares in full) | |
| Common stock to be outstanding after this offering | [●] shares | |
| Underwriters’ option to purchase additional shares of common stock | Certain of the selling stockholders have granted the underwriters a 30-day option to purchase up to [●] additional shares of our common stock at the public offering price, less underwriting discounts and commissions. | |
| Use of proceeds |
We estimate that our net proceeds from the sale of the common stock that we are offering will be approximately $[●] million, assuming an offering price of $[●] per share, the last reported sale price of our common stock on Nasdaq on [●], 2019, and after deducting estimated underwriting discounts and commissions and estimated offering expenses payable by us.
We intend to use the net proceeds of the offering of shares by us primarily for: (i) increased sales and marketing expenses; (ii) product development; and (iii) working capital and other general corporate purposes. See “Use of Proceeds” beginning on page [34] of this prospectus.
We will not receive any proceeds from the sale of common stock by selling stockholders. | |
| Risk factors | Investing in our shares of common stock involves a high degree of risk. See “Risk Factors” beginning on page [14] of this prospectus for a discussion of factors you should consider before making a decision to invest in our common stock. | |
| Listing | Our common stock is traded on Nasdaq under the symbol “LOVE.” |
The number of shares of our common stock to be outstanding immediately after the closing of this offering is based on [●] shares of common stock outstanding as of [●], 2019, and, except as otherwise indicated, all information in this prospectus reflects and assumes the following:
| ● | does not reflect the exercise of the outstanding warrants to purchase [●] shares of our common stock; and |
| ● | does not reflect [●] unvested restricted stock units and [●] shares of common stock reserved for issuance under the Equity Plan. |
9
Summary Consolidated Financial and Operating Data
The following tables present our summary consolidated financial information as of and for the periods indicated. The summary consolidated statements of operations data and the consolidated statement of cash flow data for the fiscal years ended February 3, 2019 and February 4, 2018, and the summary consolidated balance sheet data as of February 3, 2019 and February 4, 2018, are derived from our audited consolidated financial statements included elsewhere in this prospectus and should be read in conjunction with our audited consolidated financial statements, including the notes to those financial statements, which are included elsewhere in this prospectus, along with the section entitled “Management’s Discussion and Analysis of Financial Condition and Results of Operations.” Our historical results are not necessarily indicative of our future results.
| Fiscal Year Ended | ||||||||
| (dollars in thousands, except shares and per share data) | February 3, 2019 | February 4, 2018 | ||||||
| Consolidated Statement of Operations Data: | ||||||||
| Net Sales | ||||||||
| Showrooms | $ | 113,105 | $ | 77,837 | ||||
| Internet | 33,024 | 18,859 | ||||||
| Other | 19,752 | 5,114 | ||||||
| Total net sales | 165,881 | 101,810 | ||||||
| Cost of merchandise sold | 75,000 | 44,593 | ||||||
| Gross profit | 90,881 | 57,217 | ||||||
| Selling, general and administrative expenses | 76,427 | 50,848 | ||||||
| Advertising and marketing | 18,363 | 9,192 | ||||||
| Depreciation and amortization | 3,134 | 2,215 | ||||||
| Operating loss | (7,043 | ) | (5,038 | ) | ||||
| Other | ||||||||
| Interest income (expense) | 355 | (438 | ) | |||||
| Income taxes | (16 | ) | (26 | ) | ||||
| Net Loss | $ | (6,704 | ) | $ | (5,502 | ) | ||
| Net Loss Attributable to Common Stockholders | $ | (34,537 | ) | $ | (6,710 | ) | ||
| Net Loss per Common Share: | ||||||||
| Net loss per common share (basic and dilutive) (1)(2) | $ | (3.28 | ) | $ | (1.12 | ) | ||
| Weighted-average shares used in computing net loss per common share | 10,536,721 | 6,001,699 | ||||||
| Fiscal Year Ended | ||||||||
| February 3, 2019 | February 4, 2018 | |||||||
| (dollars in thousands) | ||||||||
| Non-GAAP Measurements: | ||||||||
| EBITDA (3)(4) | $ | (3,910 | ) | $ | (2,679 | ) | ||
| Adjusted EBITDA (3)(4) | $ | 3,384 | $ | 1,271 | ||||
10
| As of February 3, 2019 | As of February 4, 2018 | |||||||
| (dollars in thousands) | ||||||||
| Balance Sheet data: | ||||||||
| Cash and cash equivalents | $ | 49,071 | $ | 9,176 | ||||
| Working capital | 60,496 | 12,946 | ||||||
| Total assets | 105,014 | 41,441 | ||||||
| Total liabilities | 26,244 | 17,802 | ||||||
| Total stockholders’ equity | 78,770 | 23,638 | ||||||
| Fiscal Year Ended | ||||||||
| February 3, 2019 | February 4, 2018 | |||||||
| (dollars in thousands) | ||||||||
| Consolidated Statement of Cash flow Data: | ||||||||
| Net cash used in operating activities | $ | (7,008 | ) | $ | (2,740 | ) | ||
| Net cash used in investing activities | (11,362 | ) | (6,809 | ) | ||||
| Net cash provided by financing activities | 58,265 | 17,847 | ||||||
| Net change in cash and cash equivalents | 39,895 | 8,297 | ||||||
| Cash and cash equivalents at the end of the period | 49,071 | 9,176 | ||||||
| (1) | For the calculation of basic and diluted net loss per share, see Note 1 and Note 7 to our audited consolidated financial statements. The weighted average number of common shares used in computing net loss per common share gives effect to (i) the 1-for-2.5 reverse stock split of our common stock that occurred immediately prior to the closing of our IPO and (ii) the conversion of our outstanding preferred stock, along with the aggregate accrued or accumulated and unpaid dividends thereon, into common stock. |
| (2) | For the fiscal year ended February 3, 2019, our net loss per common share increased as a result of the deemed dividend made to preferred stockholders (see Note 7 to our audited consolidated financial statements for additional information regarding the deemed dividend). The effect was calculated as follows: |
| Fiscal year Ended February 3, 2019 | ||||
| (dollars in thousands except shares and per share data) | ||||
| Net Loss Attributable to Common Stockholders | $ | (6,704 | ) | |
| Preferred dividends and deemed dividends | (27,833 | ) | ||
| Net Loss Attributable to Common Stockholders | (34,537 | ) | ||
| Weighted average shares used in computing net loss per common share | 10,536,721 | |||
| Net loss per common share (basic and diluted) | $ | (3.28 | ) | |
| (3) | EBITDA and Adjusted EBITDA (collectively, our “Non-GAAP Measures”) are supplemental measures of financial performance that are not required by or presented in accordance with GAAP. We believe that EBITDA and Adjusted EBITDA are useful measures of operating performance, as they eliminate expenses that are not reflective of the underlying business performance, facilitate a comparison of our operating performance on a consistent basis from period-to-period and provide for a more complete understanding of the factors and trends affecting our business. We use EBITDA and Adjusted EBITDA, alongside other GAAP measures such as gross profit, operating income(loss) and net income (loss), to evaluate our operating performance and we believe these measures are useful to investors in evaluating our operating performance. |
Our Non-GAAP Measures are not GAAP measures of our financial performance or liquidity and should not be considered as alternatives to gross profit, operating income (loss) or net income (loss) as measures of financial performance, cash flows from operating activities as a measure of liquidity, or any other performance measure derived in accordance with GAAP. They should not be construed as an inference that our future results will be unaffected by unusual or non-recurring items. Additionally, our Non-GAAP Measures are not intended to be measures of free cash flow for management’s discretionary use, as they do not consider certain cash requirements such as tax payments and debt service requirements and certain other cash costs that may recur in the future. Our Non-GAAP Measures contain certain other limitations, including the failure to reflect our cash expenditures, cash requirements for working capital needs and cash costs to replace assets being depreciated and amortized. In addition, our Non-GAAP Measures exclude certain non-recurring and other charges.
11
You should be aware that in the future we may incur expenses that are the same as or similar to some of the adjustments in our Non-GAAP Measures. Our presentation of our Non-GAAP Measures should not be construed to imply that our future results will be unaffected by any such adjustments. Management compensates for these limitations by relying primarily on our GAAP results and by using our Non-GAAP Measures as supplemental information. Our Non-GAAP Measures are not necessarily comparable to other similarly titled captions of other companies due to different methods of calculation.
| (4) | We define EBITDA as net income before interest, taxes, depreciation and amortization. We define Adjusted EBITDA as EBITDA adjusted for the impact of certain non-cash and other items that we do not consider in our evaluation of ongoing operating performance. These items include sponsor fees, equity-based compensation expense, write-offs of property and equipment, deferred rent, financing expenses and certain other charges and gains that we do not believe reflect our underlying business performance. The following provides a reconciliation of net loss to EBITDA and Adjusted EBITDA for fiscal 2019 and fiscal 2018. We expect an improvement in Adjusted EBITDA for fiscal year 2020, with Adjusted EBITDA declines of $2.0 million to $3.0 million in each of the first and second quarters of fiscal 2020, flat in the third quarter and a significant improvement in the fourth quarter. The expected quarterly declines relate to infrastructure, advertising and marketing investments and the impact of tariffs given the timing of the impact of our tariff mitigation efforts. We are seeking to fully mitigate the impact of tariffs throughout fiscal 2020. |
| Fiscal Year Ended | ||||||||
| (dollars in thousands) | February 3, 2019 | February 4, 2018 | ||||||
| Net loss | $ | (6,704 | ) | $ | (5,502 | ) | ||
| Interest (income) expense | (355 | ) | 438 | |||||
| Taxes | 16 | 26 | ||||||
| Depreciation and amortization | 3,134 | 2,359 | ||||||
| EBITDA | (3,910 | ) | (2,679 | ) | ||||
| Sponsor fees (a) | 1,177 | 484 | ||||||
| Deferred Rent (b) | 531 | 360 | ||||||
| Equity-based compensation (c) | 3,310 | 951 | ||||||
| Write-off of property and equipment (d) | 255 | 197 | ||||||
| Other expenses (e) | 2,021 | 1,959 | ||||||
| Adjusted EBITDA | $ | 3,384 | $ | 1,271 | ||||
| (a) | Represents management fees charged by our equity sponsors. |
| (b) | Represents the difference between rent expense recorded and the amount paid by the Company. In accordance with generally accepted accounting principles, the Company records monthly rent expense equal to the total of the payments due over the lease term, divided by the number of months of the lease terms. |
| (c) | Represents expenses associated with stock options and restricted stock units granted to our management and equity sponsors. |
| (d) | Represents the net loss on the disposal of fixed assets. |
| (e) | Other expenses in fiscal 2019 are made up of: (1) $380 in fees and costs associated with our fundraising and reorganizing activities including the legal and professional services incurred in connection with such activities; (2) $508 in fees paid for investor relations and public relations relating to the IPO; (3) $140 in executive recruitment fees to build executive management team; (4) $261 in secondary offering legal fees; (5) $84 in travel and logistical costs associated with the offering; (6) $198 in accounting fees related to the offering; and (7) $450 in IPO bonuses paid to executives. Other expenses in fiscal 2018 are made up of: (1) $1,072 in fees and costs associated with our fundraising and reorganizing activities including the legal and professional services incurred in connection with such activities; (2) $182 in travel and logistical costs associated with our IPO; (3) $484 in costs related to our IPO and finance fees; and (4) $221 in accounting fees related to the offering. |
Estimated Preliminary Results for the Thirteen Weeks Ended May 5, 2019 (unaudited)
Presented below are certain estimated preliminary financial results for the thirteen weeks ended May 5, 2019. These ranges are based on the information available to us at this time. We have provided ranges, rather than specific amounts, because these results are preliminary. As such, our actual results may vary materially from the estimated preliminary results presented here and will not be finalized until after we close this offering. We have not identified any unusual or unique events or trends that occurred during the period that we believe will materially affect these estimates.
These are forward-looking statements and may differ from actual results. These estimates should not be viewed as a substitute for our full interim or annual financial statements prepared in accordance with GAAP. Accordingly, you should not place undue reliance on this preliminary data. Please refer to section titled “Cautionary Note Regarding Forward-Looking Statements.” These estimated preliminary results should be read in conjunction with our consolidated financial statements and related notes as well as the section captioned “Management’s Discussion and Analysis of Financial Condition and Results of Operations” included in this prospectus. For additional information, please see the section titled “Risk Factors.”
12
This data has been prepared by, and is the responsibility of, our management. Our independent registered public accounting firm, Marcum LLP, has not audited, reviewed, compiled, or performed any procedures with respect to the preliminary financial results. Accordingly, Marcum LLP does not express an opinion or any other form of assurance with respect thereto.
The following are preliminary estimates for the thirteen weeks ended May 5, 2019:
| ● | Net sales are expected to be between $[●] million and $[●] million, compared to $[●] million for the thirteen weeks ended May 6, 2018. |
| ● | Net loss is expected to be between $[●] million and $[●] million, compared to $[●] million for the thirteen weeks ended May 6, 2018. |
| ● | EBITDA is expected to be between $[●] million and $[●] million, compared to $[●] million for the thirteen weeks ended May 6, 2018. |
| ● | Adjusted EBITDA is expected to be between $[●] million and $[●] million, compared to $[●] million for the thirteen weeks ended May 6, 2018. |
| ● | The following table reconciles estimated preliminary net loss at the midpoint of the range, the most comparable GAAP measure, to estimated preliminary EBITDA and Adjusted EBITDA: |
In addition, as of May 5, 2019, our cash and cash equivalents were between $[●] million and $[●] million, and our long-term debt (including current portion of long-term debt) was between $[●] million and $[●] million.
13
An investment in the common stock of The Lovesac Company (the “Company,” “Lovesac,” “we,” “us” or “our”) involves a high degree of risk. You should carefully consider the risks and uncertainties described below, together with all of the other information contained in this prospectus, including our financial statements and the related notes thereto, before making a decision to invest in our common stock. The risks and uncertainties described below are not the only ones we face. Additional risks and uncertainties not presently known to us, or that we currently believe are not material, also may become important factors that affect us and impair our business operations. The occurrence of any of the events or developments discussed in the risk factors below could have a material and adverse impact on our business, results of operations, financial condition and cash flows, and in such case, our future prospects would likely be materially and adversely affected. If any of such events or developments were to happen, the trading price of our common stock could decline. Further, our actual results could differ materially and adversely from those anticipated in our forward-looking statements as a result of certain factors.
Risks Relating to Our Business and Industry
We have historically operated at a loss, and we may never achieve or sustain profitability.
While we have typically experienced revenue growth from period-to-period, the level of growth has at times been inconsistent. We have had to rely on a combination of cash flow from operations and new capital in order to sustain our business. We have historically operated at a loss, which has resulted in an accumulated deficit. Despite the fact that we have raised significant capital in recent periods, there can be no assurance that we will ever achieve profitability. Even if we do, there can be no assurance that we will be able to maintain or increase profitability on a quarterly or annual basis. Failure to do so would continue to have a material adverse effect on our accumulated deficit and could result in a decline in our common stock price.
Our recent growth rates may not be sustainable.
While we have experienced recent growth, maintaining that growth is dependent on a number of factors, including increased traffic to our website and showrooms, our sales conversion rate, and our ability to open new showrooms. We also rely on shop in shops, and there can be no assurance the current retailer with whom we partner will continue to house them or that we will be able to enter into similar arrangements with other retailers, which could hinder our anticipated sales growth. Our business is highly competitive, and there can be no assurance that we will be able to sustain or improve our recent growth rates.
We are subject to risks associated with our dependence on foreign manufacturing and imports for our products.
Our business highly depends on global trade, as well as trade and or other factors that impact the specific countries where our vendors’ production facilities are located. Our future success will depend in large part upon our ability to maintain our existing foreign vendor relationships and to develop new ones based on the requirements of our business and any changes in trade dynamics that might dictate changes in the locations for sourcing of products. While we rely on long-term relationships with many of our vendors, we have no long-term contracts with them and generally transact business with them on an order-by-order basis.
Many of our imported products are subject to existing duties, tariffs, anti-dumping duties and quotas that may limit the quantity or affect the price of some types of goods that we import into the United States. In addition, substantial regulatory uncertainty exists regarding international trade and trade policy, both in the United States and abroad. For example, recently President Trump has introduced a number of different tariffs on various goods imported from China. In September 2018, the Office of the U.S. Trade Representative began imposing a 10% ad valorem duty on a subset of products imported from China, inclusive of various furniture product categories. In addition, on May 10, 2019, the Office of the U.S. Trade Representative announced that the level of the tariffs increased from 10% to 25% effective immediately and that it expects to impose tariffs on substantially all remaining imports from China. We believe that nearly all of our products sourced from China are, and will continue to be, affected by the tariffs.
While we are continuing to assess these proposed tariffs on Chinese imports and are evaluating strategies to mitigate the effects of the tariffs. Our responses to the tariffs may cause our products to become less competitive due to price increases or less profitable due to lower margins. Alternatively, we may decide to source our products from other countries not subject to the increased tariffs and, as a result, we may experience delays in production or shipments of our products, and overall disruptions to our business. Our inability to effectively manage the negative impact of changing U.S. and foreign trade policies could have a material adverse effect on our business, financial condition, operating results and prospects.
Further, these changes to tariffs or other rules related to cross border trade could materially increase our cost of goods sold with respect to products that we purchase from vendors who manufacture products in China, which could in turn require us to increase our prices and, in the event consumer demand declines as a result, negatively impact our financial performance. Certain of our competitors may be better positioned than us to withstand or react to these kinds of changes including border taxes, tariffs or other restrictions on global trade and as a result we may lose market share to such competitors. Due to broad uncertainty regarding the timing, content and extent of any regulatory changes in the United States or abroad, we cannot predict the impact, if any, that these changes could have to our business, financial condition and results of operations.
Our ability to raise capital in the future may be limited. Our inability to raise capital when needed could prevent us from growing and could have a material adverse effect on our business, financial condition, operating results and prospects.
If we continue to experience insufficient cash flow from operations to support our operating and capital needs we will be required to raise additional capital through public or private financing or other arrangements. Such financing may not be available on acceptable terms, or at all. We may sell common stock, preferred stock, convertible securities and other equity securities in one or more transactions at prices and in such a manner as we may determine from time to time. If we sell any such equity securities in subsequent transactions, investors may be materially diluted. Debt financing, if available, may involve restrictive covenants and could reduce, among other things, our operational flexibility. If we cannot raise funds on acceptable terms, we may not be able to grow our business or respond to competitive pressures. In addition, debt financings may be blocked by our senior lender that provides an asset-backed revolving credit facility to fund our inventory purchases in advance of customer sales. Our lender has, and any subsequent senior lender likely will have, the right to consent to any new debt financing. There can be no assurance that our lender will provide such consent. Our inability to raise capital when needed could prevent us from growing and have a material adverse effect on our business, financial condition, operating results and prospects.
14
If we are unable to implement and maintain effective internal control over financial reporting in the future, investors may lose confidence in the accuracy and completeness of our financial reports and the market price of our common stock may be adversely affected.
As a public company, we are required to maintain internal control over financial reporting and to report any material weaknesses in such internal control. Section 404 of SOX requires that we furnish a report by management on, among other things, the effectiveness of our internal control over financial reporting beginning with the fiscal year ending February 2020. This assessment will need to include disclosure of any material weaknesses identified by our management in our internal control over financial reporting. Our independent registered public accounting firm will not be required to attest to the effectiveness of our internal control over financial reporting until our first annual report required to be filed with the SEC following the later of the date we are deemed to be an “accelerated filer” or a “large accelerated filer,” each as defined in the Securities Exchange Act of 1934, as amended (the “Exchange Act”), or the date we are no longer an “emerging growth company,” as defined in the JOBS Act. If we have a material weakness in our internal control over financial reporting, we may not detect errors on a timely basis and our financial statements may be materially misstated. We are in the process of designing and implementing the internal control over financial reporting required to comply with this obligation, which process will be time-consuming, costly and complicated. If we identify material weaknesses in our internal control over financial reporting, are unable to comply with the requirements of Section 404 of SOX in a timely manner, are unable to assert that our internal control over financial reporting is effective, or if our independent registered public accounting firm is unable to express an opinion as to the effectiveness of our internal control over financial reporting, investors may lose confidence in the accuracy and completeness of our financial reports, and the market price of our common stock could be adversely affected. In addition, we could become subject to investigations by the stock exchange on which our common stock is listed, the SEC or other regulatory authorities, which could require additional financial and management resources.
If our internal control over financial reporting or our disclosure controls and procedures are not effective, we may not be able to accurately report our financial results, prevent fraud or file our periodic reports in a timely manner, which may cause investors to lose confidence in our reported financial information and may lead to a decline in our stock price.
We rely on financial reporting and data analytics that must be accurate in order to make real-time management decisions, accurately manage our cash position, and maintain adequate inventory levels while conserving adequate cash to fund operations. In the event of a systems failure, a process breakdown, the departure of key management, or fraud, we would be unable to efficiently manage these items and may experience liquidity shortfalls that our cash position or revolving credit facility may not be able to accommodate. In such a situation, we also may not be able to accurately report our financial results, prevent fraud or file our periodic reports in a timely manner, which may cause investors to lose confidence in our reported financial information and may lead to a decline in our stock price.
We may be unable to accurately forecast our operating results and growth rate, which may adversely affect our reported results and stock price.
We may not be able to accurately forecast our operating results and growth rate. We use a variety of factors in our forecasting and planning processes, including historical results, recent history and assessments of economic and market conditions. Our growth rates may not be sustainable, and our growth depends on the continued growth of demand for the products we offer. Lower demand caused by changes in customer preferences, a weakening of the economy or other factors may result in decreased revenues or growth. Furthermore, many of our expenses and investments are fixed, and we may not be able to adjust our spending in a timely manner to compensate for any unexpected shortfall in our operating results. Failure to accurately forecast our operating results and growth rate could cause our actual results to be materially lower than anticipated. If our growth rate declines as a result, investors’ perceptions of our business may be adversely affected, and the market price of our common stock could decline.
If we fail to manage our growth effectively, our business, financial condition, operating results and prospects could be harmed.
To manage our anticipated growth effectively, we must continue to implement our operational plans and strategies, improve and expand our corporate infrastructure, information systems, and executive management and expand, train and manage our employee base. As we grow, we will need to find, train, and monitor additional employees and continue to invest in information systems that support key functions such as accounting, human resources, sales analytics, and marketing, all of which strain the time of our executive management team and our resources. If we fail to manage our growth effectively, our business, financial condition, operating results and prospects could be harmed.
15
Our inability to maintain our brand image, engage new and existing customers and gain market share could have a material adverse effect on our growth strategy and our business, financial condition, operating results and prospects.
Our ability to maintain our brand image and reputation is integral to our business and implementation of our growth strategy. Maintaining, promoting and growing our brand will depend largely on the success of our design, merchandising and marketing efforts and our ability to provide a consistent, high-quality product and customer experience. Our reputation could be jeopardized if we fail to maintain high standards for product quality and integrity and any negative publicity about these types of concerns may reduce demand for our products. While we believe our brand enjoys a loyal customer base, the success of our growth strategy depends, in part, on our ability to keep existing customers engaged and attract new customers to our brand. If we experience damage to our reputation or loss of consumer confidence, we may not be able to retain existing customers or acquire new customers, which could have a material adverse effect on our business, financial condition, operating results and prospects.
If we fail to acquire new customers, or fail to do so in a cost-effective manner, we may not be able to achieve revenue growth or profitability.
To acquire new customers, we must appeal to prospects who have historically used other means of commerce to purchase furniture, such as traditional furniture retailers. To date, we have reached new customers primarily through our showroom presence in various markets, and through social media, digital content, third-party advocates for our brand and products and by word of mouth, and now through national television advertisements. Until now, these efforts have allowed us to acquire new customers at what we believe is a reasonable cost and rate. However, there is no guarantee that these methods will continue to be successful or will drive customer acquisition rates necessary for us to achieve revenue growth or profitability.
Our business is highly competitive. Competition presents an ongoing threat to the success of our business.
Our business is rapidly evolving and intensely competitive, and we have many competitors in different industries. We compete with furniture stores, big box retailers, department stores, specialty retailers and online furniture retailers and marketplaces.
We expect competition in both retail stores and ecommerce to continue to increase. Our ability to compete successfully depends on many factors both within and beyond our control, including:
| ● | the size and composition of our customer base; |
| ● | our selling and marketing efforts; |
| ● | the quality, price, reliability and uniqueness of products we offer; |
| ● | the convenience of the shopping experience that we provide; |
| ● | our ability to distribute our products and manage our operations; and |
| ● | our reputation and brand strength. |
Many of our current and potential competitors have longer operating histories, greater brand recognition, larger fulfillment infrastructures, greater technological capabilities, faster and less costly shipping, significantly greater financial, marketing and other resources and larger customer bases than we do. These factors may allow our competitors to, among other things, derive greater sales from their existing customer base, acquire customers at lower costs and respond more quickly than we can to new or emerging technologies and changes in consumer habits. These competitors may engage in more extensive research and development efforts, undertake more far-reaching marketing campaigns and adopt more aggressive pricing policies. If we are unable to successfully compete, our business, financial condition, operating results and prospects could be materially adversely affected.
16
Our business depends on effective marketing and increased customer traffic.
We rely on a variety of marketing strategies to compete for customers and increase sales. If our competitors increase their spending on marketing, if our marketing is less effective than that of our competitors, or if we do not adequately leverage the technology and data analytics needed to generate concise competitive insight, our business, financial condition, operating results and prospects could be adversely affected.
Our increased use of social media poses reputational risks.
As use of social media becomes more prevalent, our susceptibility to risks related to social media increases. The immediacy of social media precludes us from having real-time control over postings made regarding us via social media, whether matters of fact or opinion. Information distributed via social media could result in immediate unfavorable publicity we may not be able to reverse. This unfavorable publicity could result in damage to our reputation and therefore have a material adverse effect on our business, financial condition, operating results and prospects.
Our efforts to launch new products may not be successful.
We plan to expand our product line in the future. We may not be able to develop products which are attractive to our customers, and our costs to develop new products may be significant. It may take longer than we might expect for a product, even if ultimately successful, to achieve attractive sales results. Failure to successfully develop or market new products or delays in the development of new products could have a material adverse effect on our financial condition, results of operations and business.
We rely on the performance of members of management and highly skilled personnel. If we are unable to attract, develop, motivate and retain well-qualified employees, our business could be harmed.
We believe our success has depended, and continues to depend, on the efforts and talents of Shawn Nelson, our founder, member of the board of directors and Chief Executive Officer, Andrew Heyer, our Chairman, Jack Krause, our President and Chief Operating Officer, Donna Dellomo, our Executive Vice President and Chief Financial Officer, and other members of our management team. Our future success depends on our continuing ability to attract, develop, motivate and retain highly qualified and skilled employees. The market for such employees in the cities in which we operate is competitive. Qualified individuals are in high demand, and we may incur significant costs to attract and retain them. The loss of any of our key employees, including members of our senior management team, could materially adversely affect our ability to execute our business plan, and we may not be able to find adequate replacements. Our inability to recruit and develop mid-level managers could have similar adverse effects on our ability to execute our business plan.
Some of our officers and other key employees are at-will employees, meaning that they may terminate their employment relationship with us at any time, and their knowledge of our business and industry would be extremely difficult to replace. While others have employment agreements with stated terms, they could still leave our employ. If we do not succeed in retaining and motivating existing employees or attracting well-qualified employees, our business, financial condition, operating results and prospects may be materially adversely affected.
System interruptions that impair customer access to our sites or other performance failures in our technology infrastructure could damage our business, reputation and brand, and substantially harm our business and results of operations.
The satisfactory performance, reliability and availability of our website, transaction processing systems and technology infrastructure are critical to our reputation, and our ability to acquire and retain customers and maintain adequate customer service levels. We currently rely on a variety of third party service providers to support mission critical systems and the efficient flow of merchandise from and between warehouses and showrooms to customers. For example, we rely on common carriers for the delivery of merchandise purchased by customers through our website and in our showrooms, and the systems we employ to communicate delivery schedules and update customers about order tracking interface with the information systems of these common carriers. Our own systems, which are customized versions of ecommerce, customer relationship management, payment processing, and inventory management software technologies deployed by numerous retailers and wholesalers in a variety of industries, must work seamlessly in order for information to flow correctly and update accurately across these systems. Any failure in this regard could result in negative customer experiences, putting our brand and growth at risk.
17
Through third parties that underwrite customer risk, we offer financing options in order to increase the market demand for our products among customers who may not be able to buy them using cash. The systems of these third parties must work efficiently in order to give customers real-time credit availability. Changes in the risk underwriting or technologies of these third parties may result in lower credit availability to our potential customers and therefore reduced sales. The occurrence of any of the foregoing could substantially harm our business and results of operations.
Unauthorized disclosure of sensitive or confidential information, whether through a breach of our computer system or otherwise, could severely hurt our business.
Certain aspects of our business involve the receipt, storage and transmission of customers’ personal information, consumer preferences and payment card information, as well as confidential information about our associates, our suppliers and our Company, some of which is entrusted to third-party service providers and vendors. Despite the security measures we have in place, our facilities and systems, and those of third parties with which we do business, may be vulnerable to security breaches, acts of vandalism and theft, computer viruses, misplaced or lost data, programming and/or human errors, or other similar events.
An electronic security breach in our systems (or in the systems of third parties with which we do business) that results in the unauthorized release of individually identifiable information about customers or other sensitive data could occur and have a material adverse effect on our reputation, lead to substantial financial losses from remedial actions, and lead to a substantial loss of business and other liabilities, including possible punitive damages. In addition, as the regulatory environment relating to retailers and other companies’ obligation to protect such sensitive data becomes increasingly rigorous, with new and constantly changing requirements applicable to our business, compliance with those requirements could result in additional costs, and a material failure on our part to comply could subject us to fines, other regulatory sanctions and lawsuits.
Our business is sensitive to economic conditions and consumer spending.
We face numerous business risks relating to macroeconomic factors. Consumer purchases of discretionary items, including our products, generally decline during recessionary periods and other times when disposable income is lower. Factors impacting discretionary consumer spending include general economic conditions, wages and employment, consumer debt, reductions in net worth based on severe market declines, residential real estate and mortgage markets, taxation, volatility of fuel and energy prices, interest rates, consumer confidence, political and economic uncertainty and other macroeconomic factors. Deterioration in economic conditions or increasing unemployment levels may reduce the level of consumer spending and inhibit consumers’ use of credit, which may adversely affect our sales. In recessionary periods and other periods where disposable income is adversely affected, we may have to increase the number of promotional sales or otherwise dispose of inventory for which we have previously paid to manufacture, which could further adversely affect our financial performance. It is difficult to predict when or for how long any of these conditions could affect our business and a prolonged economic downturn could have a material adverse effect on our business, financial condition, operating results and prospects.
A substantial portion of our business is dependent on a small number of suppliers. A material disruption at any of our suppliers’ manufacturing facilities could prevent us from meeting customer demand, reduce our sales, and/or negatively affect our financial results.
We do not own or operate any manufacturing facilities and therefore depend on third-party suppliers for the manufacturing of all of our products. Moreover, a substantial portion of our business is dependent on a small number of suppliers. Sacs, which represented approximately 25% of our revenues in fiscal 2019 and 26% of our revenues in fiscal 2018, are currently manufactured by a single manufacturer in Texas. Sactionals, which represented approximately 72.5% of our revenues in fiscal 2019 and 71.3% of our revenues in fiscal 2018, are manufactured by suppliers in China and Vietnam and our outdoor Sactionals are manufactured in Vietnam.
18
Any of our suppliers’ manufacturing facilities, or any of the machines within an otherwise operational facility, could cease operations unexpectedly due to a number of events, which could materially and adversely impact our business, operations and financial condition. These events include but are not limited to:
| ● | equipment failure; |
| ● | fires, floods, earthquakes, hurricanes, or other catastrophes; |
| ● | unscheduled maintenance outages; |
| ● | utility and transportation infrastructure disruptions; |
| ● | labor difficulties; |
| ● | other operational problems; |
| ● | war or terrorism; |
| ● | political, social or economic instability; or |
| ● | financial instability or bankruptcy of any such supplier. |
Our reliance on international suppliers increases our risk of supply chain disruption, which could materially increase the cost and reduce or delay the supply of our products, which could adversely affect our business, financial condition, operating results and prospects.
Our current suppliers are located in China, Vietnam and the United States. Our reliance on international suppliers increases our risk of supply chain disruption. Events that could cause disruptions to our supply chain include but are not limited to:
| ● | the imposition of additional trade laws or regulations; |
| ● | the imposition of additional duties, tariffs and other charges on imports and exports; |
| ● | foreign currency fluctuations; |
| ● | theft; and |
| ● | restrictions on the transfer of funds. |
The occurrence of any of the foregoing could materially increase the cost and reduce or delay the supply of our products, which could adversely affect our business, financial condition, operating results and prospects.
19
Our reliance on suppliers in developing countries increases our risk with respect to available manufacturing infrastructure, labor and employee relations, political and economic stability, corruption, and regulatory, environmental, health and safety compliance.
Our reliance on suppliers in developing countries increases our risk with respect to infrastructure available to support manufacturing, labor and employee relations, political and economic stability, corruption, and regulatory, environmental, health and safety compliance. Any failure of our suppliers to comply with ethical sourcing standards or labor or other local laws in the country of manufacture, or the divergence of a supplier’s labor practices from those generally accepted as ethical in the United States, could disrupt the shipment of products, force us to locate alternative manufacturing sources, reduce demand for our products, damage our reputation and/or expose us to potential liability for their wrongdoings. Any of these events could have a material adverse effect on our reputation, business, financial condition, operating results and prospects.
Our reliance on international manufacturers and suppliers, including vendors located in jurisdictions presenting an increased risk of bribery and corruption, exposes us to legal, reputational, and supply chain risk through the potential for violations of federal and international anti-corruption law.
We derive a significant portion of our products from third-party manufacturers and suppliers in foreign countries, including countries and territories perceived to carry an increased risk of corrupt business practices, such as China. The U.S. Foreign Corrupt Practices Act (the “FCPA”), prohibits corporations in the United States and their representatives from offering, promising, authorizing or making payments to any foreign government official, government staff member, political party or political candidate in an attempt to obtain or retain business abroad. Notwithstanding our efforts to conduct our operations in material compliance with the FCPA, our international vendors could be determined to be our “representatives” under the FCPA, which could expose us to potential liability for the actions of these vendors under the FCPA. If we or our vendors were determined to have violated the FCPA, the U.K. Bribery Act of 2010, or any of the anti-corruption and anti-bribery laws in the countries and territories where we and our vendors do business, we could suffer severe fines and penalties, profit disgorgement, injunctions on future conduct, securities litigation, bans on transacting certain business, and other consequences that could have a material adverse effect on our reputation, business, financial condition, operating results and prospects. In addition, the costs we may incur in defending against any anti-corruption investigations stemming from our or our vendors’ actions could be significant. Moreover, any actual or alleged corruption in our supply chain could carry significant reputational harms, including negative publicity, loss of good will, and decline in share price.
Most of our products are shipped from our suppliers by ocean vessel. If a disruption occurs in the operation of ports through which our products are imported, we may incur increased costs and suffer delays, which could have a material adverse effect on our business, financial condition, operating results and prospects.
Most of our products are shipped from our suppliers by ocean vessel. If a disruption occurs in the operation of ports through which our products are imported, we may incur increased costs related to air freight or use of alternative ports. Shipping by air is significantly more expensive than shipping by ocean and our margins could be reduced. Shipping to alternative ports could also lead to delays in receipt of our products. We rely on third-party shipping companies to deliver our products to us. Failures by these shipping companies to deliver our products to us or lack of capacity in the shipping industry could lead to delays in receipt of our products or increased expense in the delivery of our products. Any of these developments could have a material adverse effect on our business, financial condition, operating results and prospects.
Increases in the demand for, or the price of, raw materials used to manufacture our products or other fluctuations in sourcing or distribution costs could increase our costs and negatively impact our gross margin.
We believe that we have strong supplier relationships, and we work with our suppliers to manage cost increases. Our gross margin depends, in part, on our ability to mitigate rising costs or shortages of raw materials used to manufacture our products. Raw materials used to manufacture our products are subject to availability constraints and price volatility impacted by a number of factors, including supply and demand for fabrics, weather, government regulations, economic conditions and other unpredictable factors. In addition, our sourcing costs may fluctuate due to labor conditions, transportation or freight costs, energy prices, currency fluctuations or other unpredictable factors. The occurrence of any of the foregoing could increase our costs, delay or reduce the availability of our products and negatively impact our gross margin.
20
Our inability to manage our inventory levels and products, including with respect to our omni-channel operations, could have a material adverse effect on our business, financial condition, operating results and prospects.
Inventory levels in excess of customer demand may result in lower than planned financial performance. Alternatively, if we underestimate demand for our products, we may experience inventory shortages resulting in missed sales and lost revenues. Either of these events could significantly affect our operating results and brand image and loyalty. Our financial performance may also be impacted by changes in our products and pricing. These changes could have a material adverse effect on our business, financial condition, operating results and prospects.
Our inability to manage the complexities created by our omni-channel operations may have a material adverse effect on our business, financial condition, operating results and prospects.
Our omni-channel operations create additional complexities in our ability to manage inventory levels, as well as certain operational issues, including timely shipping and returns. Accordingly, our success depends to a large degree on continually evolving the processes and technology that enable us to plan and manage inventory levels and fulfill orders, address any related operational issues and further align channels to optimize our omni-channel operations. If we are unable to successfully manage these complexities, it may have a material adverse effect on our business, financial condition, operating results and prospects.
We may be subject to product liability claims if people or property are harmed by the products we sell.
We have not had any significant product liability claims to date. We place a high priority on designing our products to be safe for consumers and safety test our products in third-party laboratories. Still, the products we sell or have manufactured may expose us to product liability claims, litigation and regulatory action relating to personal injury, death and environmental or property damage. Some of our agreements with our suppliers and international manufacturers may not indemnify us from product liability for a particular supplier’s or international manufacturer’s products, or our suppliers or international manufacturers may not have sufficient resources or insurance to satisfy their indemnity and defense obligations. Although we maintain liability insurance, we cannot be certain that our coverage will be adequate for liabilities actually incurred or that insurance will continue to be available to us on economically reasonable terms, or at all. Any product liability claims asserted against us could, among other things, harm our reputation, damage our brand, cause us to incur significant costs, and have a material adverse effect on our business, results of operations and financial condition.
Our ability to attract customers to our showrooms depends heavily on successfully locating our showrooms in suitable locations. Any impairment of a showroom location, including any decrease in customer traffic, could cause our sales to be lower than expected.
We plan to open new showrooms in high street and urban locations and historically we have favored top tier mall locations near luxury and contemporary retailers that we believe are consistent with our key customers’ demographics and shopping preferences. Sales at these showrooms are derived, in part, from the volume of foot traffic in these locations. Showroom locations may become unsuitable due to, and our sales volume and customer traffic generally may be harmed by, among other things:
| ● | economic downturns in a particular area; |
| ● | competition from nearby retailers selling similar products; |
| ● | changing consumer demographics in a particular market; |
| ● | changing preferences of consumers in a particular market; |
| ● | the closing or decline in popularity of other businesses located near our store; |
| ● | reduced customer foot traffic outside a showroom location; and |
| ● | store impairments due to acts of God or terrorism. |
21
Even if a showroom location becomes unsuitable, we will generally be unable to cancel the long term lease associated with such showroom.
We may be unable to successfully open and operate new showrooms, which could have a material adverse effect on our business, financial condition, operating results and prospects.
As of February 3, 2019, we had 75 showrooms, but our growth strategy requires us to increase our showroom base. There can be no assurance that we will succeed in opening additional showrooms. If we are unable to successfully open and operate new showrooms, it could have a material adverse effect on our business, financial condition, operating results and prospects.
Our ability to successfully open and operate new showrooms depends on many factors, including, among other things, our ability to:
| ● | identify new markets where our products and brand image will be accepted or the performance of our showrooms will be successful; |
| ● | obtain desired locations, including showroom size and adjacencies, in targeted high street and urban locations and top tier malls; |
| ● | negotiate acceptable lease terms, including desired rent and tenant improvement allowances; |
| ● | achieve brand awareness, affinity and purchaser intent in new markets; |
| ● | hire, train and retain showroom associates and field management; |
| ● | assimilate new showroom associates and field management into our corporate culture; |
| ● | source and supply sufficient inventory levels; |
| ● | successfully integrate new showrooms into our existing operations and information technology systems; and |
| ● | have the capital necessary to fund new showrooms. |
In addition, our new showrooms may not be immediately profitable, and we may incur significant losses until these showrooms become profitable. Unavailability of desired showroom locations, delays in the acquisition or opening of new showrooms, delays or costs resulting from a decrease in commercial development due to capital restraints, difficulties in staffing and operating new showroom locations or a lack of customer acceptance of showrooms in new market areas may negatively impact our new showroom growth and the costs or the profitability associated with new showrooms. While we are seeking to mitigate some of the risks related to our mall based showrooms by opening high street and lifestyle center-based showrooms and continuing to build our online sales, there can be no assurance that this strategy will be successful or lead to greater sales.
As we expand our showroom base, we may not be able to achieve the showroom sales growth rates that we have achieved in the past, which could cause our share price to decline.
As we expand our showroom base, we may not be able to achieve the showroom sales growth rates that we have achieved historically. If our showroom sales growth rates decline or fail to meet market expectations, the value of our common stock could decline.
In addition, the results of operations of our showroom locations have fluctuated in the past and can be expected to continue to fluctuate in the future. A variety of factors affect showroom sales, including, among others, consumer spending patterns, fashion trends, competition, current economic conditions, pricing, inflation, the timing of the release of new merchandise and promotional events, changes in our product assortment, the success of marketing programs and weather conditions. If we misjudge the market for our products, we may have excess inventory of some of our products and miss opportunities for other products. These factors may cause our showroom sales results in the future to be materially lower than recent periods or our expectations, which could harm our results of operations and result in a decline in the price of our common stock.
22
We have and will continue to expend significant capital remodeling our existing showrooms, and there is no guarantee that this will result in incremental showroom traffic or sales.
We intend to continue remodeling our existing showroom base to reflect our new showroom design, and we intend to expend significant capital doing so. While preliminary results appear promising, there is no guarantee that the capital spent on these remodeled showrooms will result in increased showroom traffic or increased sales.
Our lease obligations are substantial and expose us to increased risks.
We do not own any of our showrooms. Instead, we rent all of our showroom spaces pursuant to leases. Nearly all of our leases require a fixed annual rent, and many of them require the payment of additional rent if showroom sales exceed a negotiated amount. Most of our leases are “net” leases that require us to pay all costs of insurance, maintenance and utilities, as well as applicable taxes.
Our required payments under these leases are substantial and account for a significant portion of our selling, general and administrative expenses. We expect that any new showrooms we open will also be leased, which will further increase our lease expenses and require significant capital expenditures. Our substantial lease obligations could have significant negative consequences, including, among others:
| ● | increasing our vulnerability to general adverse economic and industry conditions; |
| ● | limiting our ability to obtain additional financing; |
| ● | requiring a substantial portion of our available cash to pay our rental obligations, reducing cash available for other purposes; |
| ● | limiting our flexibility in planning for or reacting to changes in our business or in the industry in which we compete; and |
| ● | placing us at a disadvantage with respect to some of our competitors who sell their products exclusively online. |
Many of our leases contain relocation clauses that allow the landlord to move the location of our showrooms. Moreover, as our leases expire, we may be unable to negotiate acceptable renewals. If either of these events occur, our business, sales and results of operations may be harmed.
Many of our leases include relocation clauses that allow the landlord to move the location of our showrooms. If any of our showrooms are relocated, there can be no assurance that the new location will experience the same levels of customer traffic or success that the prior location experienced. In addition, as our leases expire, we may fail to negotiate renewals, either on commercially acceptable terms or at all, which could cause us to close showrooms in desirable locations. We may also be unable to enter into new leases on terms acceptable to us or in desirable locations. If any of the foregoing occur, our business, sales and results of operations may be harmed.
We are required to make substantial lease payments under our leases, and any failure to make these lease payments when due would likely harm our business.
We depend on cash flow from operations to pay our lease expenses and to fulfill our other cash needs. If our business does not generate sufficient cash flow from operating activities, and sufficient funds are not otherwise available to us from other sources, we may not be able to service our substantial lease expenses, which would harm our business.
23
Moreover, our showroom leases are generally long term and non-cancelable, and we generally expect future showrooms to be subject to similar long term, non-cancelable leases. If an existing or future showroom is not profitable, and we decide to close it, we may nonetheless be required to perform our obligations under the applicable lease including, among other things, paying the base rent for the balance of the lease term if we cannot negotiate a mutually acceptable termination payment.
Changes in lease accounting standards may materially and adversely affect us.
The Financial Accounting Standards Board (“FASB”), recently adopted new accounting rules that will apply to annual reporting periods beginning after December 15, 2018, including interim reporting periods within that reporting period. The Company, as an “emerging growth company,” has elected to defer compliance with new or revised financial accounting standards and, as a result, the new accounting rule will apply to annual reporting periods beginning after December 15, 2019, and interim reporting periods within annual reporting periods beginning after December 15, 2020. When the rules are effective, we will be required to capitalize all leases on our balance sheet and account for our showroom leases as assets and liabilities, where we previously accounted for such leases on an “off balance sheet” basis. As a result, a significant amount of lease-related assets and liabilities will be recorded on our balance sheet, and we may be required to make other changes to the recording and classification of our lease-related expenses. These changes will not directly impact our overall financial condition. However, they could cause investors or others to believe that we are highly leveraged and could change the calculations of financial metrics and covenants under our debt facilities and third-party financial models regarding our financial condition.
Uncertainties in the interpretation and application of the 2017 Tax Cuts and Jobs Act could materially affect our tax obligations and effective tax rate.
On December 22, 2017, the U.S. Tax Cuts and Jobs Act of 2017, or the “2017 Tax Act,” was signed into law and includes several key tax provisions that affected us, including a reduction of the statutory corporate tax rate from 35% to 21% effective for tax years beginning after December 31, 2017, elimination of certain deductions, and changes to how the United States imposes income tax on multinational corporations, among others. The 2017 Tax Act requires complex computations to be performed that were not previously required in U.S. tax law, significant judgments to be made in interpretation of the provisions of the 2017 Tax Act, significant estimates in calculations, and the preparation and analysis of information not previously relevant or regularly produced. The U.S. Treasury Department, the IRS, and other standard-setting bodies will continue to interpret or issue guidance on how provisions of the U.S. Tax Act will be applied or otherwise administered. As future guidance is issued, we may adjust amounts that we have previously recorded that may materially impact our financial statements in the period in which the adjustments are made.
We depend on our ecommerce business and failure to successfully manage this business and deliver a seamless omni-channel shopping experience to our customers could have an adverse effect on our growth strategy, business, financial condition, operating results and prospects.
Sales through our ecommerce channel account for a significant portion of our revenues. Our business, financial condition, operating results and prospects are dependent on maintaining our ecommerce business. Dependence on our ecommerce business and the continued growth of our direct and retail channels subjects us to certain risks, including:
| ● | the failure to successfully implement new systems, system enhancements and Internet platforms; |
| ● | the failure of our technology infrastructure or the computer systems that operate our website and their related support systems, causing, among other things, website downtimes, telecommunications issues or other technical failures; |
| ● | the reliance on third-party computer hardware/software providers; |
| ● | rapid technological change; |
| ● | liability for online content; |
24
| ● | violations of federal, state, foreign or other applicable laws, including those relating to data protection; |
| ● | credit card fraud; |
| ● | cyber security and vulnerability to electronic break-ins and other similar disruptions; and |
| ● | diversion of traffic and sales from our stores. |
Our failure to successfully address and respond to these risks and uncertainties could negatively impact sales, increase costs, diminish our growth prospects and damage the reputation of our brand, each of which could have a material adverse effect on our business, financial condition, operating results and prospects.
Our inability to successfully optimize our omni-channel operations and maintain a relevant and reliable omni-channel experience for our customers could have a material adverse effect on our growth strategy and our business, financial condition, operating results and prospects.
Growing our business through our omni-channel operations is key to our growth strategy. Our goal is to offer our customers seamless access to our products across our channels, and our success depends on our ability to anticipate and implement innovations in sales and marketing strategies to appeal to existing and potential customers who increasingly rely on multiple channels, such as ecommerce, to meet their shopping needs. Failure to enhance our technology and marketing efforts to align with our customers’ developing shopping preferences could significantly impair our ability to meet our strategic business and financial goals. If we do not successfully optimize our omni-channel operations, or if they do not achieve their intended objectives, it could have a material adverse effect on our business, financial condition, operating results and prospects.
If we are unable to successfully adapt to consumer shopping preferences or develop and maintain a relevant and reliable omni-channel experience for our customers, our financial performance and brand image could be adversely affected.
We are continuing to grow our omni-channel business model. While we interact with many of our customers through our showrooms, our customers are increasingly using computers, tablets and smartphones to make purchases online and to help them make purchasing decisions when in our showrooms. Our customers also engage with us online through our social media channels, including Facebook and Instagram, by providing feedback and public commentary about aspects of our business. Omni-channel retailing is rapidly evolving. Our success depends, in part, on our ability to anticipate and implement innovations in customer experience and logistics in order to appeal to customers who increasingly rely on multiple channels to meet their shopping needs. If for any reason we are unable to continue to implement our omni-channel initiatives or provide a convenient and consistent experience for our customers across all channels that delivers the products they want, when and where they want them, our financial performance and brand image could be adversely affected.
Purchasers of furniture may choose not to shop online, which could affect the growth of our business.
The online market for furniture is less developed than the online market for apparel, consumer electronics and other consumer products in the United States. While we believe this market is growing, it still accounts for a small percentage of the market as a whole. We are relying on online sales for our continued success and growth. If the online market for furniture does not gain wider acceptance, our growth and business may suffer.
In addition, our success in the online market will depend, in part, on our ability to attract consumers who have historically purchased furniture through traditional retailers. We may have to incur significantly higher and more sustained advertising and promotional expenditures in order to attract additional online consumers to our website and convert them into purchasing customers. Specific factors that could impact consumers’ willingness to purchase furniture from us online include:
| ● | concerns about buying products, and in particular larger products, with a limited physical storefront, face-to-face interaction with sales personnel and the ability to physically examine products; |
25
| ● | actual or perceived lack of security of online transactions and concerns regarding the privacy of personal information; |
| ● | inconvenience associated with returning or exchanging items purchased online; and |
| ● | usability, functionality and features of our website. |
If the online shopping experience we provide does not appeal to consumers or meet the expectations of existing customers, we may not acquire new customers at rates consistent with historical periods, and existing customers’ buying patterns may not be consistent with historical buying patterns. If either of these events occur, our business, sales and results of operations may be harmed.
Product warranty claims could have a material adverse effect on our business.
We provide a lifetime warranty on most components of our products, which, if deficient, could lead to warranty claims. In prior years, the Company did not maintain a reserve for warranty claims. As a result of a projected increase in sales, the Company began recording a reserve for warranty claims for fiscal 2019. However, there can be no assurance that our reserve for warranty claims will be adequate and additional or reduced warranty reserves may be required. Material warranty claims could, among other things, harm our reputation and damage our brand, cause us to incur significant repair and/or replacement costs, and material adversely affect our business, financial condition, operating results and prospects.
Significant merchandise returns could harm our business.
We allow our customers to return products, subject to our return policy. While the Company has experienced relatively few product returns, this could change, and, if customer returns are significant, our business, financial condition, operating results and prospects could be harmed. Further, we modify our policies relating to returns from time to time, which may result in customer dissatisfaction or an increase in the number of product returns.
We are subject to risks related to online payment methods.
We accept payment using a variety of methods, including credit card, debit card, PayPal and gift cards. As we offer new payment options to consumers, we may become subject to additional regulations, compliance requirements and fraud. For certain payment methods, including credit and debit cards, we pay interchange and other fees, which may increase over time and increase our operating costs. We are also subject to payment card association operating rules and certification requirements, including the Payment Card Industry Data Security Standard and rules governing electronic funds transfers, which could change or be reinterpreted to make it difficult or impossible for us to comply.
As our business changes, we may also be subject to different rules under existing standards, which may require new assessments that involve costs above what we currently pay for compliance. If we fail to comply with the rules or requirements of any provider of a payment method we accept, if the volume of fraud in our transactions limits or terminates our rights to use payment methods we currently accept, or if a data breach occurs relating to our payment systems, we may, among other things, be subject to fines or higher transaction fees and may lose, or have restrictions placed upon, our ability to accept credit card and debit card payments from consumers or our ability to facilitate other types of online payments. If any of these events were to occur, our business, financial condition and operating results could be materially adversely affected.
In addition, we occasionally receive orders placed with fraudulent credit card data. We may suffer losses as a result of orders placed with fraudulent credit card data even if the associated financial institution approved payment of the orders. Under current credit card practices, we may be liable for fraudulent credit card transactions. If we are unable to detect or control credit card fraud, our liability for these transactions could harm our business, financial condition, operating results and prospects.
26
Government regulation of the Internet and ecommerce is evolving, and unfavorable changes or failure by us to comply with these regulations could substantially harm our business and results of operations.
We are subject to general business regulations and laws as well as regulations and laws specifically governing the Internet and ecommerce. Existing and future regulations and laws could impede the growth of the Internet, ecommerce or mobile commerce. These regulations and laws may involve taxes, tariffs, privacy and data security, anti-spam, content protection, electronic contracts and communications, consumer protection, Internet neutrality and gift cards. It is not clear how existing laws governing issues such as property ownership, sales and other taxes and consumer privacy apply to the Internet as the vast majority of these laws were adopted prior to the advent of the Internet and do not contemplate or address the unique issues raised by the Internet or ecommerce. It is possible that general business regulations and laws, or those specifically governing the Internet or ecommerce, may be interpreted and applied in a manner that is inconsistent from one jurisdiction to another and may conflict with other rules or our practices.
Though we seek at all times to be in full compliance with all such laws, we cannot be sure that our practices have complied, comply or will comply fully with all such laws and regulations. Any failure, or perceived failure, by us to comply with any of these laws or regulations could result in damage to our reputation, a loss in business and proceedings or actions against us by governmental entities or others. Any such proceeding or action could damage our reputation and brand, force us to spend significant amounts in defense of these proceedings, distract our management, increase our costs of doing business, decrease the use of our website by consumers and result in the imposition of monetary liability. We may also be contractually liable to indemnify and hold harmless third parties from the costs or consequences of non-compliance with any such laws or regulations.
A significant disruption in, or breach in security of, our information technology systems or violations of data protection laws could materially adversely affect our business and reputation.
In the ordinary course of business, we collect and store confidential information, including proprietary business information belonging to us, our customers, suppliers, business partners and other third parties and personally identifiable information of our employees. We rely on information technology systems to protect this information and to keep financial records, process orders, manage inventory, coordinate shipments to customers, and operate other critical functions. Our information technology systems may be susceptible to damage, disruptions or shutdowns due to power outages, hardware failures, telecommunication failures and user errors. If we experience a disruption in our information technology systems, it could result in the loss of sales and customers and significant incremental costs, which could materially adversely affect our business. We may also be subject to security breaches caused by computer viruses, illegal break-ins or hacking, sabotage, or acts of vandalism by disgruntled employees or third parties. The risk of a security breach or disruption, particularly through cyberattack or cyber intrusion, including by computer hackers, foreign governments and cyber terrorists, has increased as the number, intensity and sophistication of attempted attacks and intrusions from around the world have increased. Our information technology network and systems have been and, we believe, continue to be under constant attack. Accordingly, despite our security measures or those of our third-party service providers, a security breach may occur, including breaches that we may not be able to detect. Security breaches of our information technology systems could result in the misappropriation or unauthorized disclosure of confidential.
As we expand our network of customers and facilitate their transactions and interactions with us or otherwise evolve our products and services, we will increasingly be subject to laws and regulations relating to the collection, use, retention, privacy, security, and transfer of information, including personally identifiable information of our employees and customers. These laws and regulations may change or be interpreted and applied differently over time and from jurisdiction to jurisdiction, and it is possible they will be interpreted and applied in ways that will materially and adversely affect our business. For example, the California Consumer Privacy Act of 2018 (the “CCPA”) will become effective on January 1, 2020. The CCPA imposes stringent data privacy and data protection requirements for the data of California residents, and provides for penalties for noncompliance of up to $7,500 per violation. The CCPA was amended in September 2018, and further amendments have been, and likely will continue to be, proposed to this legislation in 2019. It remains unclear how various provisions of the CCPA will be interpreted and enforced. The effects of this legislation potentially are far-reaching and may require us to modify our data processing practices and policies and to incur substantial costs and expenses in an effort to comply. Data privacy and security continues to be a rapidly evolving area, and further legislative activity will likely arise in the U.S., the EU, and other jurisdictions. For example, other states in the U.S. have proposed laws regarding privacy and data protection that contain obligations similar to the CCPA, and the federal government is contemplating federal privacy legislation. In addition, U.S. and international laws that have been applied to protect user privacy (including laws regarding unfair and deceptive practices in the United States) may be subject to evolving interpretations or applications in light of privacy developments.
We may be unable to protect our trademarks or brand image, which could harm our business.
We rely on trademark registrations and common law trademark rights to protect the distinctiveness of our brand. However, there can be no assurance that the actions we have taken to establish and protect our trademarks will be adequate to prevent counterfeiting or infringement of our trademarks by others. We may not be able to claim or assert trademark or unfair competition claims against third parties for any number of reasons, and our trademarks may be found invalid or unenforceable. A judge, jury or other adjudicative body may find that the conduct of competitors does not infringe or violate our trademark rights. Third parties may claim that the use of our trademarks and branding infringe, dilute or otherwise violate the common law or registered marks of that party, or that our sales and marketing efforts constitute unfair competition. Such claims could result in injunctive relief prohibiting the use of our marks, branding and marketing activities, and significant damages, treble damages and attorneys’ fees and costs could be awarded as a result of such claims. Moreover, U.S. and foreign trademark offices may refuse to grant existing and future trademark applications and may cancel or partially cancel trademark registrations.
27
The laws of certain foreign countries may not protect the use of unregistered trademarks to the same extent as do the laws of the United States. As a result, international protection of our brand image may be limited, and our right to use our trademarks outside the United States could be impaired. Other persons or entities may have rights to trademarks that contain portions of our marks or may have registered similar or competing marks for furniture and/or accessories in foreign countries where our products are manufactured. There may also be other prior registrations of trademarks identical or similar to our trademarks in other foreign countries of which we are not aware. Accordingly, it may be possible for others to prevent the manufacture of our branded merchandise in certain foreign countries or the sale or exportation of our branded merchandise from certain foreign countries to the United States. If we were unable to reach a licensing arrangement with these parties, we might be unable to manufacture our products in those countries. Our inability to register our trademarks or purchase or license the right to use the relevant trademarks or logos in these jurisdictions could limit our ability to manufacture our products in less costly markets or penetrate new markets in jurisdictions outside the United States. The occurrence of any of the foregoing could harm our business.
We may not be able to adequately protect our intellectual property rights.
We regard our customer and prospect lists, trademarks, domain names, copyrights, patents and similar intellectual property as critical to our success, and we rely on trademark, copyright and patent law, trade secret protection, agreements and other methods with our employees and others to protect our proprietary rights. We have 17 issued U.S. utility patents and 21 issued foreign utility patents, that are scheduled to expire between 2022 and 2037. We have 7 pending U.S. utility patent applications and 36 pending foreign utility patent applications. We expect to file U.S. and foreign patent applications for future innovations. We might not be able to obtain protection in the United States or internationally for our intellectual property, and we might not be able to obtain effective intellectual property protection in countries in which we may in the future sell products. If we are unable to obtain such protection, our business, financial condition, operating results and prospects may be harmed. Additionally, employees, contractors or consultants may misappropriate or disclose our confidential information or intellectual property and agreements with those persons may not exist, may not cover the information or intellectual property in question, or may not be enforceable, all of which could have an adverse impact on our business, financial condition, operating results and prospects for the future.
The protection of our intellectual property rights may require the expenditure of significant financial, managerial and operational resources. Notwithstanding such expenditures, the steps we take to protect our intellectual property may not adequately protect our rights or prevent third parties from infringing, misappropriating or disclosing confidential information or intellectual property. The validity, enforceability and infringement of our patents, trademarks, trade secrets and other intellectual property rights may be challenged by others in litigation or through administrative process, and we may not prevail in such disputes. Additionally, because the process of obtaining patent and trademark protection is expensive and time-consuming, we may not be able to prosecute all necessary or desirable patent and trademark applications at a reasonable cost or in a timely manner, and such applications may never be granted. Even if such applications issue as patents and trademarks, there can be no assurance that these patents and trademarks will adequately protect our intellectual property, as the legal standards relating to the validity, enforceability and scope of protection of patents, trademarks and other intellectual property rights are uncertain. If we are unable to adequately protect our intellectual property rights, our business, financial condition, operating results and prospects may be harmed.
We also might be required to spend significant resources to monitor and protect our intellectual property rights. We may not be able to discover or determine the extent of any infringement, misappropriation, disclosure or other violation of our intellectual property rights, confidential information or other proprietary rights. We may initiate claims or litigation against others for infringement, misappropriation or violation of our intellectual property rights, confidential information or other proprietary rights or to establish the validity of such rights. Despite our efforts, we may be unable to prevent third parties, former employees, consultants or independent contractors from infringing upon, misappropriating, disclosing or otherwise violating our intellectual property rights, confidential information and other proprietary rights. In addition, initiating claims or litigations against others for infringement, misappropriation, disclosure or violation of our intellectual property rights, confidential information or proprietary rights will be expensive, and may be prohibitively expensive. Any litigation or other dispute resolution mechanism, whether or not it is resolved in our favor, could result in significant expense to us and divert the efforts of our technical and management personnel, which may materially adversely affect our business, financial condition, operating results and prospects.
28
Our products or marketing activities may be found to infringe or violate the intellectual property rights of others.
Third parties may assert claims or initiate litigation asserting that our products or our marketing activities infringe or violate such third parties’ patent, copyright, trademark, trade secret or other intellectual property rights. The asserted claims and/or litigation could include claims against us or our suppliers alleging infringement of intellectual property rights with respect to our products or components of such products.
Regardless of the merit of the claims, if our products are alleged to infringe or violate the intellectual property rights of other parties, we could incur substantial costs and we may have to, among other things:
| ● | obtain licenses to use such intellectual property rights, which may not be available on commercially reasonable terms, or at all; |
| ● | redesign our products or change our marketing activities to avoid infringement or other violations of the intellectual property rights of others; |
| ● | stop using the subject matter protected by the intellectual property held by others; |
| ● | pay significant compensatory and/or enhanced damages, attorneys’ fees and costs; and/or |
| ● | defend litigation or administrative proceedings which may be costly whether we win or lose, and which could result in a substantial diversion of our time, financial and management resources. |
If any of the foregoing occur, our business, financial condition, operating results and prospects could be materially adversely affected.
Risks Relating to this Offering and Ownership of Our Common Stock
Our equity sponsor, Mistral, will continue to have significant influence over us following the completion of this offering, and its interests could conflict with those of our other stockholders.
Immediately following this offering, our equity sponsor, Mistral, will control approximately [●]% of our common stock (or [●]% if the underwriters’ option to purchase additional shares is exercised in full). SAC Acquisition LLC, our principal stockholder, is controlled by Mistral through ownership interests held by various investment vehicles affiliated with Mistral. Currently, Messrs. Bradley, Heyer and Phoenix are directors of the Company and are also principals of Mistral. As a result, SAC Acquisition LLC and Mistral are able to influence matters requiring approval by our stockholders, including the election of directors and the approval of mergers or other extraordinary transactions. SAC Acquisition LLC and Mistral may have interests that differ from yours and may vote in a way with which you disagree and which may be adverse to your interests. The concentration of ownership may also have the effect of delaying, preventing or deterring a change of control of the Company, could deprive our stockholders of an opportunity to receive a premium for their common stock as part of a sale of our Company and might ultimately affect the market price of our common stock.
Holders of our outstanding warrants to purchase common stock will own a significant portion of our common stock following the exercise of such warrants. The exercise of such warrants will significantly dilute the investors participating in this offering.
Holders of our outstanding warrants to purchase common stock would own a significant portion of our common stock following the exercise of such warrants ([●]% after giving effect to exercise of the warrants). During the three-year period following our IPO, holders of our outstanding warrants have the right to exercise such warrants and purchase shares of our common stock at a price per share of $16.00 (except for the warrant granted to Roth Capital Partners, LLC in connection with our IPO, which has a five-year term and is exercisable at a price per share of $19.20). The exercise will dilute investors participating in this offering.
29
An active trading market for our common stock may not be sustained and investors may not be able to resell their shares at or above the price at which they purchased them.
We have a limited history as a public company. In the absence of an active trading market for our common stock, investors may not be able to sell their common stock at or above the price they paid or at the time that they would like to sell. In addition, an inactive market may impair our ability to raise capital by selling shares and may impair our ability to acquire other companies or technologies by using our shares as consideration, which, in turn, could harm our business.
The trading price of the shares of our common stock has been and is likely to continue to be highly volatile, and purchasers of our common stock could incur substantial losses.
The stock market in general has experienced volatility that has often been unrelated to the operating performance of particular companies. As a result of this volatility, investors may not be able to sell their common stock at or above the price they paid. The market price for our common stock may be influenced by many factors, including:
| ● | actual or anticipated fluctuations in our customer growth, sales, or other operating results; |
| ● | variations between our actual operating results and the expectations of securities analysts, investors, and the financial community; |
| ● | any forward-looking financial or operating information we may provide to the public or securities analysts, any changes in this information, or our failure to meet expectations based on this information; |
| ● | actions of securities analysts who initiate or maintain coverage of us, changes in financial estimates by any securities analysts who follow our Company, or our failure to meet these estimates or the expectations of investors; |
| ● | additional shares of our common stock being sold into the market by us or our existing stockholders, or the anticipation of such sales, including if existing stockholders sell shares into the market when applicable “lock-up” periods end; |
| ● | price and volume fluctuations in the overall stock market, including as a result of trends in the economy as a whole; |
| ● | announcements by us or our competitors of significant products, acquisitions, strategic partnerships, joint ventures, or capital commitments; |
| ● | lawsuits threatened or filed against us; |
| ● | developments in new legislation or rulings by judicial or regulatory bodies; and |
| ● | other events or factors, including those resulting from war or incidents of terrorism, or responses to these events. |
Our actual results may vary from our estimated preliminary unaudited financial results [and operating metrics] for the thirteen weeks ended May 5, 2019 included under “Summary Consolidated Financial and Operating Data” and the variances may be material.
This prospectus contains certain preliminary unaudited financial results [and operating metrics] for the thirteen weeks ended May 5, 2019. Upon completion of our independent auditors’ review of our results for the thirteen weeks ended May 5, 2019, it is possible significant changes to such preliminary results [and operating metrics] may be necessary. Finally, such preliminary unaudited financial results and metrics do not reflect all of our material financial information as of and for the thirteen weeks ended May 5, 2019, and we therefore caution you not to place undue reliance on them. See “Cautionary Note Regarding Forward-Looking Information” for a discussion of factors that may cause our actual results to vary from our estimates.
We may fail to meet publicly announced financial guidance or other expectations about our business, which could cause our stock to decline in value.
From time to time, we provide preliminary financial results or forward-looking financial guidance, to our investors. Such statements are based on our current views, expectations and assumptions and involve known and unknown risks and uncertainties that may cause actual results, performance, achievements or stock prices to be materially different from any future results, performance, achievements or stock prices expressed or implied by such statements. Such risks and uncertainties include, among others: changes to the assumptions used to forecast or calculate such guidance, the risk that our business does not perform as expected, changes in the markets for our products and services and risks related to competitive factors. Such risks are summarized in the other risks factors included in this prospectus.
We may be subject to securities litigation, which is expensive and could divert management attention.
The market price of our common stock may be volatile, and in the past, companies that have experienced volatility in the market price of their stock have been subject to securities class action litigation. We may be the target of this type of litigation in the future. Securities litigation against us could result in substantial costs and divert our management’s attention from other business concerns, which could have a material adverse effect on our business, financial condition, and results of operations.
30
Our failure to meet the continued listing requirements of Nasdaq could result in a delisting of our common stock.
If we fail to satisfy the continued listing requirements of Nasdaq, such as minimum financial and other continued listing requirements and standards, including those regarding minimum stockholders’ equity, minimum share price, and certain corporate governance requirements, Nasdaq may take steps to delist our common stock. Such a delisting would likely have a negative effect on the price of our common stock and would impair your ability to sell or purchase our common stock when you wish to do so. In the event of a delisting, we would expect to take actions to restore our compliance with Nasdaq's listing requirements, but we can provide no assurance that any such action taken by us would allow our common stock to become listed again, stabilize the market price or improve the liquidity of our common stock, prevent our common stock from dropping below the Nasdaq minimum bid price requirement, or prevent future non-compliance with Nasdaq's listing requirements.
If securities or industry analysts do not publish research or publish inaccurate or unfavorable research about our business, our stock price and trading volume could decline.
The trading market for our common stock depends in part on the research and reports that securities or industry analysts publish about us or our business. We do not currently have, and may never obtain, research coverage by securities and industry analysts. If no securities or industry analysts commence coverage of our Company, the trading price for our common stock would be negatively impacted. If we obtain securities or industry analyst coverage and if one or more of the analysts who cover us downgrades our common stock or publishes inaccurate or unfavorable research about our business, our stock price would likely decline. If one or more of these analysts ceases coverage of us or fails to publish reports on us regularly, demand for our common stock could decrease, which could cause our stock price and trading volume to decline.
The requirements of being a public company may strain our resources, result in more litigation, and divert the attention of Company management.
As a public company, we are subject to the reporting requirements of the Exchange Act, SOX, the Dodd-Frank Wall Street Reform and Consumer Protection Act, the listing requirements of Nasdaq, and other applicable securities rules and regulations. Complying with these rules and regulations increases our legal and financial compliance costs, makes some activities more difficult, time-consuming and costly, and increases demand on our systems and resources.
The Exchange Act requires, among other things, that we file annual, quarterly, and current reports with respect to our business and operating results. By disclosing information in this prospectus and in filings required of a public company, our business and financial condition will become more visible, which may result in threatened or actual litigation, including by competitors and other third parties. If those claims are successful, our business could be seriously harmed. Even if the claims do not result in litigation or are resolved in our favor, the time and resources needed to resolve them could divert our management’s resources and seriously harm our business.
You may experience future dilution as a result of future equity offerings.
In order to raise additional capital, we may in the future offer additional shares of our common stock or other securities convertible into or exchangeable for our common stock at prices that may not be the same as the price per share in this offering. We may sell shares or other securities in any other offering at a price per share that is less than the price per share paid by the investors in this offering, and investors purchasing shares or other securities in the future could have rights superior to existing stockholders. The price per share at which we sell additional shares of our common stock, or securities convertible or exchangeable into common stock, in future transactions may be higher or lower than the price per share paid by investors in this offering.
We are an “emerging growth company,” and any decision on our part to comply only with certain reduced reporting and disclosure requirements applicable to emerging growth companies could make our common stock less attractive to investors.
We are an “emerging growth company” as defined in the JOBS Act, and we could be an emerging growth company for up to five years following the completion of our IPO. For as long as we continue to be an emerging growth company, we may choose to take advantage of exemptions from various reporting requirements applicable to other public companies but not to emerging growth companies, including:
| ● | not being required to have our independent registered public accounting firm audit our internal control over financial reporting under Section 404 of SOX; |
31
| ● | reduced disclosure obligations regarding executive compensation in our periodic reports and proxy statements; and |
| ● | exemptions from the requirements of holding a nonbinding advisory vote on executive compensation and stockholder approval of any golden parachute payments not previously approved. |
Under the JOBS Act, emerging growth companies can also delay adopting new or revised accounting standards until such time as those standards apply to private companies. Investors may find our common stock less attractive if we choose to rely on any of the exemptions or accommodations afforded to emerging growth companies. If investors find our common stock less attractive because we rely on any of these exemptions or accommodations, there may be a less active trading market for our common stock and the market price of our common stock may be more volatile. We have elected to take advantage of the extended transition period for new or revised accounting standards.
Anti-takeover provisions in our charter documents and under Delaware law could make an acquisition of our Company more difficult, and limit attempts by our stockholders to replace or remove our current management.
Provisions in our amended and restated certificate of incorporation and our amended and restated bylaws may have the effect of delaying or preventing a change of control or changes in our management. Our certificate of incorporation and bylaws include provisions that:
| ● | permit the board of directors to establish the number of directors and fill any vacancies and newly created directorships by the affirmative vote of a majority of the directors or stockholders holding at least 25% of the issued and outstanding shares of common stock; |
| ● | provide that directors may only be removed by the majority of the shares of voting stock then outstanding entitled to vote generally in election of directors; |
| ● | require a majority of all directors who constitute the board of directors or stockholders holding at least 25% of the issued and outstanding shares of our common stock to adopt, amend or repeal provisions of our bylaws; |
| ● | require 50% of the voting power of all then outstanding shares of capital stock of the Company entitled to vote generally in election of directors to amend, alter or repeal, or adopt any provision inconsistent with certain sections of our certificate of incorporation; |
| ● | except as otherwise provided by the terms of any series of preferred stock, special meetings of stockholders of the Company may be called only by the board of directors, the chairperson of the board of directors, the chief executive officer, the president (in the absence of a chief executive officer) or at least twenty-five percent (25%) of all then outstanding shares of capital stock of the Company entitled to vote generally in the election of directors, voting together as a single class; and |
| ● | establish advance notice requirements for nominations for election to our board of directors or for proposing matters that can be acted upon by stockholders at annual stockholder meetings. |
These provisions may frustrate or prevent any attempts by our stockholders to replace or remove our current management by making it more difficult for stockholders to replace members of our board of directors, which is responsible for appointing the members of our management. In addition, because we are incorporated in Delaware, we are governed by the provisions of Section 203 of the Delaware General Corporation Law, which generally prohibits a Delaware corporation from engaging in any of a broad range of business combinations with any holder of at least 15% of our capital stock for a period of three years following the date on which the stockholder became a 15% stockholder.
32
We do not expect to declare any dividends in the foreseeable future.
The continued operation and growth of our business will require substantial cash. Accordingly, we do not anticipate paying any cash dividends to holders of our common stock at any time in the foreseeable future. Any determination to pay future dividends will be at the discretion of our board of directors and will depend upon our results of operations, financial condition, contractual restrictions, indebtedness, restrictions imposed by applicable law and other factors our board of directors deems relevant. Consequently, the only way investors may be able to realize future gain on their investment is to sell their shares of common stock after the price of such shares has appreciated. However, there is no guarantee that investors’ shares of common stock will appreciate in value or even maintain the price at which our investors purchased their shares of common stock.
Sales of a substantial number of shares of our common stock into the public market by certain of our stockholders could depress our stock price.
Sales of substantial amounts of our common stock in the public market could reduce the prevailing market prices for our common stock. Substantially all of our outstanding common stock is eligible for sale as are shares of common stock issuable under vested and exercisable stock options. If our existing stockholders sell a large number of shares of our common stock, or the public market perceives that existing stockholders might sell shares of common stock, the market price of our common stock could decline significantly. Existing stockholder sales might also make it more difficult for us to sell additional equity securities at a time and price that we deem appropriate.
Moreover, after giving effect to this offering, holders of [●]% of our outstanding common stock (including the selling stockholders in this offering) have rights, subject to certain conditions such as the lock-up arrangements described above, to require us to file registration statements for the public sale of their shares or to include their shares in registration statements that we may file for ourselves or other stockholders. Registration of these shares under the Securities Act of 1933, as amended, or the Securities Act, would result in the shares becoming freely tradable without restriction under the Securities Act, except for shares held by our affiliates as defined in Rule 144 under the Securities Act. Any sales of securities by these stockholders could have a material adverse effect on the trading price of our common stock. See “Certain Relationships and Related Party Transactions—Amended and Restated Stockholders Agreement.”
33
Cautionary Note Regarding Forward-Looking Statements
This prospectus contains forward-looking statements. Forward-looking statements are projections in respect of future events or our future financial performance. In some cases, you can identify forward-looking statements by terms such as “anticipate,” “believe,” “could,” “continue,” “estimate,” “expect,” “intend,” “may,” “plan,” “predict,” “potential,” “should,” “will” and “would” or the negatives of these terms or other comparable terminology.
You should not place undue reliance on forward looking statements. We cannot assure you that the events and circumstances reflected in the forward-looking statements will be achieved or occur. The cautionary statements set forth in this prospectus, including in “Risk Factors” and elsewhere, identify important factors which you should consider in evaluating our forward-looking statements. These factors include, among other things:
| ● | our ability to achieve or sustain profitability; | |
| ● | our ability to sustain recent growth rates; | |
| ● | our dependence on foreign manufacturing and imports for our products; | |
| ● | our ability to raise capital; |
| ● | our ability to implement and maintain effective internal control over financial reporting; | |
| ● | our ability to accurately report our financial results, prevent fraud or file our periodic reports in a timely manner if our internal control over financial reporting or disclosure controls and procedures are not effective; | |
| ● | our ability to accurately forecast our operating results and growth rate; | |
| ● | our ability to manage our growth effectively; | |
| ● | our ability to maintain our brand image, engage new and existing customers and gain market share; | |
| ● | our ability to acquire new customers or do so in a cost-effective manner; | |
| ● | our ability to compete successfully; |
| ● | our ability to effectively market our products and increase customer traffic; |
| ● | our ability to management reputational risks associated with the use of social media; and |
| ● | our ability to launch new products. |
These risks are not exhaustive. Other sections of this prospectus include additional factors that could harm our business and financial performance. Moreover, we operate in a very competitive and rapidly changing environment. New risk factors emerge from time to time, and it is not possible for our management to predict all risk factors nor can we assess the impact of all factors on our business or the extent to which any factor, or combination of factors, may cause actual results to differ from those contained in, or implied by, any forward-looking statements.
Although the forward-looking statements in this prospectus are based on our beliefs, assumptions and expectations, taking into account all information currently available to us, we cannot guarantee future transactions, results, performance, achievements or outcomes. No assurance can be made to any investor by anyone that the expectations reflected in our forward-looking statements will be attained, or that deviations from them will not be material and adverse. We undertake no obligation, other than as may be required by law, to re-issue this prospectus or otherwise make public statements updating our forward-looking statements.
We estimate that the net proceeds to us from the sale of common stock by this prospectus will be approximately $[●], assuming the sale by us of [●] shares of our common stock at an assumed public offering price of $[●] per share and after deducting the underwriting discounts and commissions, and estimated offering expenses payable by us of approximately $[●].
The principal purposes of this offering are to increase our capitalization and financial flexibility. As of the date of this prospectus, we cannot specify with certainty all of the particular uses for the net proceeds to us from this offering. However, we currently intend to use the net proceeds from this offering primarily (i) to increase sales and marketing, (ii) for product development, and (iii) for working capital and other general corporate purposes.
The amount and timing of expenditures or for any particular use may vary based on a number of factors, including the amount of cash used in or provided by our operations. Our management will have broad discretion in the application of these proceeds, and investors will be relying on the judgment of our management regarding the application of the proceeds of this offering.
We will not receive any proceeds from the sale of shares of common stock by the selling stockholders.
34
We have never declared nor paid any dividends on our common stock since incorporation and do not anticipate that we will do so in the foreseeable future. All shares of our common stock are entitled to an equal share of any dividends declared and paid. Payment of future dividends, if any, will be at the discretion of our board of directors and will depend on our financial condition, results of operations, capital requirements, restrictions contained in any financing instruments, provisions of applicable law and other factors the board of directors deems relevant.
The following table describes our capitalization as of February 3, 2019:
| ● | on an actual basis; and |
| ● | on an as adjusted basis to give effect to the sale of [●] shares of common stock by us in this offering at the assumed public offering price of at an assumed public offering price of $[●] per share, the last reported sale price of our common stock on Nasdaq on [●], 2019, after deducting underwriting discounts and other estimated offering expenses payable by us. |
The as adjusted information below is illustrative only, and our capitalization following the closing of this offering will be adjusted based on the actual public offering price and other terms of this offering determined at pricing.
You should read the following table in connection with the sections entitled “Selected Consolidated Financial Information,” “Management’s Discussion and Analysis of Financial Condition and Results of Operation,” “Description of Capital Stock” and our financial statements and related notes included elsewhere in this prospectus.
| As of February 3, 2019 | ||||||||
| Actual | As Adjusted | |||||||
| Indebtedness | $ | [●] | $ | [●] | ||||
| Stockholders’ equity: | ||||||||
| Common Stock, par value $0.00001 per share; 40,000,000 shares authorized, 13,588,568 shares issued and outstanding; 40,000,000 shares authorized, [●] | 136 | [●] | ||||||
| Preferred Stock, par value $0.00001 per share; 10,000,000 shares authorized and no shares issued and outstanding; 10,000,000 shares authorized and no shares issued and outstanding | - | - | ||||||
| Accumulated paid-in capital | 141,727,807 | [●] | ||||||
| Accumulated deficit | (62,957,809 | ) | [●] | |||||
| Total stockholders’ equity | 78,770,134 | [●] | ||||||
| Total capitalization | $ | [●] | $ | [●] | ||||
The as adjusted information discussed above is to illustrate only and will change based on the actual public offering price, number of shares and other terms of this offering determined in pricing.
The number of shares of our common stock outstanding shown in the as adjusted column excludes:
| ● | the outstanding warrants to purchase [●] shares of our common stock at an exercise price of $16.00 per share; |
| ● | the [●] unvested restricted stock units and [●] shares of common stock reserved for issuance under the Equity Plan; and |
| ● | the outstanding warrant to purchase 281,750 shares of our common stock at an exercise price of $19.20 per share, with a five-year term, issued to Roth Capital Partners, LLC as part of the underwriting agreement in connection with the Company’s IPO. |
35
Dilution
If you invest in our common stock in this offering, your interest will be diluted to the extent of the difference between the public offering price per share of our common stock and the as adjusted net tangible book value per share of our common stock upon completion of this offering. Net tangible book value per share represents the amount of our total tangible assets (total assets less intangible assets) less total liabilities, divided by the number of shares of our common stock outstanding as of February 3, 2019.
Our as adjusted net tangible book value (deficit) as of February 3, 2019 was $[●] or approximately $[●] per share of common stock, based upon 13,588,568 shares outstanding as of February 3, 2019. As adjusted net tangible book value per share represents the amount of our total tangible assets less total liabilities, divided by the total number of shares outstanding as of February 3, 2019.
Our as adjusted net tangible book value (deficit) at February 3, 2019 would have been approximately $[●] million or $[●] per share. This represents an immediate increase in as adjusted net tangible book value of approximately $[●] per share to our existing stockholders, and immediate dilution of $[●] per share to investors purchasing shares in this offering. As adjusted net tangible book value per share represents our as adjusted net tangible book value, plus the effect of the sale by us of [●] shares of our common stock in this offering at a public offering at the assumed public offering price of $[●] per share, the last reported sale price of our common stock on Nasdaq on [●], 2019, and after deducting the estimated underwriting discount and offering expenses payable by us.
Dilution in as adjusted net tangible book value (deficit) per share represents the difference between the amount per share paid by purchasers of our common stock in this offering and the as adjusted net tangible book value per share of our common stock immediately after this offering.
The following table and the discussion thereafter illustrate the per share dilution to investors purchasing shares in the offering:
| Assumed public offering price per share | $ | [●] | ||
| Net tangible book value per share as of February 3, 2019 | [●] | |||
| Increase in net tangible book value per share attributable to new investors in this offering | [●] | |||
| As adjusted net tangible book value per share after this offering | [●] | |||
| Dilution in as adjusted net tangible book value per share to new investors in this offering | $ | [●] |
A $1.00 increase (decrease) in the assumed public offering price of $[●] per share would increase (decrease) the as adjusted net tangible book value by $[●] million, or $[●] per share, assuming that the number of shares offered by us, as set forth on the cover page of this prospectus, remains the same and after deducting the estimated underwriting discount and offering expenses payable by us.
The following table summarizes, on an as adjusted basis as of February 3, 2019, the differences between the number of shares of common stock purchased from us, the total consideration paid to us and the average price per share paid by existing stockholders and by new investors purchasing shares of common stock in this offering. The calculation below is based on an assumed public offering price of $[●] per share, the last reported sale price of our common stock on Nasdaq on [●], 2019.
| Shares Purchased | Total Consideration | Average Price Per Share |
||||||||||||||||||
| # | % | $ | % | |||||||||||||||||
| Existing stockholders | [●] | [●] | % | $ | [●] | [●] | % | $ | [●] | |||||||||||
| New investors purchasing common stock | [●] | [●] | [●] | [●] | $ | [●] | ||||||||||||||
| Total | [●] | [●] | % | [●] | [●] | % | $ | [●] | ||||||||||||
Furthermore, we may choose to raise additional capital through the sale of equity or convertible debt securities due to market conditions or strategic considerations even if we believe we have sufficient funds for our current or future operating plans. We may also choose to engage in strategic acquisitions through the issuance of shares of our stock. New investors will experience further dilution if any of our outstanding options or warrants are exercised, new options are issued and exercised under our equity incentive plans or we issue additional shares of common stock, other equity securities or convertible debt securities in the future.
The as adjusted information discussed above is illustrative only and will change based on the actual public offering price, number of shares and other terms of this offering determined at pricing. The total number of shares reflected in the discussion and tables above is based on shares of common stock outstanding as of February 3, 2019 excludes:
| ● | the outstanding warrants to purchase [●] shares of our common stock at an exercise price of $16.00 per share; |
| ● | the [●] unvested restricted stock units and [●] shares of common stock reserved for issuance under the Equity Plan; and |
| ● | the outstanding warrant to purchase 281,750 shares of our common stock at an exercise price of $19.20 per share, with a five-year term, issued to Roth Capital Partners, LLC as part of the underwriting agreement in connection with the Company’s IPO. |
36
SELECTED CONSOLIDATED FINANCIAL INFORMATION
The following tables present selected consolidated financial information as of and for the periods indicated. The selected consolidated statements of operations data and the consolidated statement of cash flow data for the fiscal years ended February 3, 2019 and February 4, 2018, and the selected consolidated balance sheet data as of February 3, 2019 and February 4, 2018 are derived from our audited consolidated financial statements included elsewhere in this prospectus and should be read in conjunction with our audited consolidated financial statements including the notes to those financial statements, which are included elsewhere in this prospectus, along with the section entitled “Management’s Discussion and Analysis of Financial Condition and Results of Operations.” Our historical results are not necessarily indicative of our future results.
| Fiscal Year Ended | ||||||||
| February 3, 2019 | February 4, 2018 | |||||||
| (dollars in thousands, except shares and per share data) | ||||||||
| Consolidated Statement of Operations Data: | ||||||||
| Net Sales | ||||||||
| Showrooms | $ | 113,105 | $ | 77,837 | ||||
| Internet | 33,024 | 18,859 | ||||||
| Other | 19,752 | 5,114 | ||||||
| Total net sales | 165,881 | 101,810 | ||||||
| Cost of merchandise sold | 75,000 | 44,593 | ||||||
| Gross profit | 90,881 | 57,217 | ||||||
| Selling, general and administrative expenses | 76,427 | 50,848 | ||||||
| Advertising and marketing | 18,363 | 9,192 | ||||||
| Depreciation and amortization | 3,134 | 2,215 | ||||||
| Operating loss | (7,043 | ) | (5,038 | ) | ||||
| Other | ||||||||
| Interest income (expense) | 355 | (438 | ) | |||||
| Income taxes | (16 | ) | (26 | ) | ||||
| Net Loss | $ | (6,704 | ) | $ | (5,502 | ) | ||
| Net Loss Attributable to Common Stockholders | $ | (34,537 | ) | $ | (6,710 | ) | ||
| Net Loss per Common Share: | ||||||||
| Net loss per common share (basic and dilutive) (1)(2) | $ | (3.28 | ) | $ | (1.12 | ) | ||
| Weighted-average shares used in computing net loss per common share | 10,536,721 | 6,001,699 | ||||||
| Fiscal Year Ended | ||||||||
| February 3, 2019 | February 4, 2018 | |||||||
| (dollars in thousands) | ||||||||
Non-GAAP Measurements: | ||||||||
| EBITDA (3)(4) | $ | (3,910 | ) | $ | (2,679 | ) | ||
| Adjusted EBITDA (3)(4) | $ | 3,384 | $ | 1,271 | ||||
37
| As of February 3, 2019 | As of February 4, 2018 | |||||||
| (dollars in thousands) | ||||||||
| Balance Sheet data: | ||||||||
| Cash and cash equivalents | $ | 49,071 | $ | 9,176 | ||||
| Working capital | 60,496 | 12,946 | ||||||
| Total assets | 105,014 | 41,441 | ||||||
| Total liabilities | 26,244 | 17,802 | ||||||
| Total stockholders’ equity | 78,770 | 23,638 | ||||||
| Fiscal Year Ended | ||||||||
| February 3, 2019 | February 4, 2018 | |||||||
| (dollars in thousands) | ||||||||
| Consolidated Statement of Cash flow Data: | ||||||||
| Net cash used in operating activities | $ | (7,008 | ) | $ | (2,740 | ) | ||
| Net cash used in investing activities | (11,362 | ) | (6,809 | ) | ||||
| Net cash provided by financing activities | 58,265 | 17,847 | ||||||
| Net change in cash and cash equivalents | 39,895 | 8,297 | ||||||
| Cash and cash equivalents at the end of the period | 49,071 | 9,176 | ||||||
| (1) | For the calculation of basic and diluted net loss per share, see Note 1 and Note 7 to our audited consolidated financial statements. The weighted average number of common shares used in computing net loss per common share gives effect to (i) the 1-for-2.5 reverse stock split of our common stock that occurred immediately prior to the closing of our IPO and (ii) the conversion of our outstanding preferred stock, along with the aggregate accrued or accumulated and unpaid dividends thereon, into common stock. |
| (2) | For the fiscal year ended February 3, 2019, our net loss per common share increased as a result of the deemed dividend made to preferred stockholders (see Note 7 to our audited consolidated financial statements for additional information regarding the deemed dividend). The effect was calculated as follows: |
| Fiscal year Ended February 3, 2019 | ||||
| (dollars in thousands except shares and per share data) | ||||
| Net Loss Attributable to Common Stockholders | $ | (6,704 | ) | |
| Preferred dividends and deemed dividends | (27,833 | ) | ||
| Net Loss Attributable to Common Stockholders | (34,537 | ) | ||
| Weighted average shares used in computing net loss per common share | 10,536,721 | |||
| Net loss per common share (basic and diluted) | $ | (3.28 | ) | |
| (3) | EBITDA and Adjusted EBITDA (collectively, our “Non-GAAP Measures”) are supplemental measures of financial performance that are not required by or presented in accordance with GAAP. We believe that EBITDA and Adjusted EBITDA are useful measures of operating performance, as they eliminate expenses that are not reflective of the underlying business performance, facilitate a comparison of our operating performance on a consistent basis from period-to-period and provide for a more complete understanding of the factors and trends affecting our business. We use EBITDA and Adjusted EBITDA, alongside other GAAP measures such as gross profit, operating income(loss) and net income (loss), to evaluate our operating performance and we believe these measures are useful to investors in evaluating our operating performance. |
Our Non-GAAP Measures are not GAAP measures of our financial performance or liquidity and should not be considered as alternatives to gross profit, operating income (loss) or net income (loss) as measures of financial performance, cash flows from operating activities as a measure of liquidity, or any other performance measure derived in accordance with GAAP. They should not be construed as an inference that our future results will be unaffected by unusual or non-recurring items. Additionally, our Non-GAAP Measures are not intended to be measures of free cash flow for management’s discretionary use, as they do not consider certain cash requirements such as tax payments and debt service requirements and certain other cash costs that may recur in the future. Our Non-GAAP Measures contain certain other limitations, including the failure to reflect our cash expenditures, cash requirements for working capital needs and cash costs to replace assets being depreciated and amortized. In addition, our Non-GAAP Measures exclude certain non-recurring and other charges.
38
You should be aware that in the future we may incur expenses that are the same as or similar to some of the adjustments in our Non-GAAP Measures. Our presentation of our Non-GAAP Measures should not be construed to imply that our future results will be unaffected by any such adjustments. Management compensates for these limitations by relying primarily on our GAAP results and by using our Non-GAAP Measures as supplemental information. Our Non-GAAP Measures are not necessarily comparable to other similarly titled captions of other companies due to different methods of calculation.
| (4) | We define EBITDA as net income before interest, taxes, depreciation and amortization. We define Adjusted EBITDA as EBITDA adjusted for the impact of certain non-cash and other items that we do not consider in our evaluation of ongoing operating performance. These items include sponsor fees, equity-based compensation expense, write-offs of property and equipment, deferred rent, financing expenses and certain other charges and gains that we do not believe reflect our underlying business performance. The following provides a reconciliation of net loss to EBITDA and Adjusted EBITDA for fiscal 2019 and fiscal 2018. We expect an improvement in Adjusted EBITDA for fiscal year 2020, with Adjusted EBITDA declines of $2.0 million to $3.0 million in each of the first and second quarters of fiscal 2020, flat in the third quarter and a significant improvement in the fourth quarter. The expected quarterly declines relate to infrastructure, advertising and marketing investments and the impact of tariffs given the timing of the impact of our tariff mitigation efforts. We are seeking to fully mitigate the impact of tariffs throughout fiscal 2020. |
| Fiscal Year Ended | ||||||||
| (dollars in thousands) | February 3, 2019 | February 4, 2018 | ||||||
| Net loss | $ | (6,704 | ) | $ | (5,502 | ) | ||
| Interest (income) expense | (355 | ) | 438 | |||||
| Taxes | 16 | 26 | ||||||
| Depreciation and amortization | 3,134 | 2,359 | ||||||
| EBITDA | (3,910 | ) | (2,679 | ) | ||||
| Sponsor fees (a) | 1,177 | 484 | ||||||
| Deferred Rent (b) | 531 | 360 | ||||||
| Equity-based compensation (c) | 3,310 | 951 | ||||||
| Write-off of property and equipment (d) | 255 | 197 | ||||||
| Other expenses (e) | 2,021 | 1,959 | ||||||
| Adjusted EBITDA | $ | 3,384 | $ | 1,271 | ||||
| (a) | Represents management fees charged by our equity sponsors. |
| (b) | Represents the difference between rent expense recorded and the amount paid by the Company. In accordance with generally accepted accounting principles, the Company records monthly rent expense equal to the total of the payments due over the lease term, divided by the number of months of the lease terms. |
| (c) | Represents expenses associated with stock options and restricted stock units granted to our management and equity sponsors. |
| (d) | Represents the net loss on the disposal of fixed assets. |
| (e) | Other expenses in fiscal 2019 are made up of: (1) $380 in fees and costs associated with our fundraising and reorganizing activities including the legal and professional services incurred in connection with such activities; (2) $508 in fees paid for investor relations and public relations relating to the IPO; (3) $140 in executive recruitment fees to build executive management team; (4) $261 in secondary offering legal fees; (5) $84 in travel and logistical costs associated with the offering; (6) $198 in accounting fees related to the offering; and (7) $450 in IPO bonuses paid to executives. Other expenses in fiscal 2018 are made up of: (1) $1,072 in fees and costs associated with our fundraising and reorganizing activities including the legal and professional services incurred in connection with such activities; (2) $182 in travel and logistical costs associated with our IPO; (3) $484 in costs related to our IPO and finance fees; and (4) $221 in accounting fees related to the offering. |
39
Management’s Discussion and Analysis of Financial Condition and Results of Operations
The following discussion and analysis should be read in conjunction with our consolidated financial statements and related notes thereto included elsewhere in this prospectus, as well as the information presented under “Selected Historical Consolidated Financial and Other Data.” The following discussion contains forward-looking statements that reflect our plans, estimates and assumptions. Our actual results could differ materially from those discussed in the forward-looking statements. Factors that could cause such differences are discussed in the sections of this prospectus titled “Risk Factors” and “Cautionary Note Regarding Forward-Looking Statements.”
We operate on a 52- or 53-week fiscal year that ends on the Sunday closest to February 1. Each fiscal year generally is comprised of four 13-week fiscal quarters, although in the years with 53 weeks, the fourth quarter represents a 14-week period. Fiscal year 2019 ended on February 3, 2019 and was comprised of 52 weeks. Fiscal year 2018 ended on February 4, 2018 and was comprised of 53 weeks.
Overview
We are a technology driven, omni-channel company that designs, manufactures and sells unique, high quality furniture comprised of modular couches called Sactionals and premium foam beanbag chairs called Sacs. We market and sell our products through modern and efficient showrooms and, increasingly, through online sales. We believe that our ecommerce centric approach, coupled with our ability to deliver our large upholstered products through nationwide express couriers, is unique to the furniture industry.
The name “Lovesac” was derived from our original innovative product, a premium foam beanbag chair, the Sac. The Sac was developed in 1995 and provided the foundation for the Company. Sales of this product have been increasing, representing $41.2 million for fiscal 2019, as compared to $26.9 million for fiscal 2018. We believe that the large size, comfortable foam filling and irreverent branding of our Sacs products have been instrumental in growing a loyal customer base and our positive, fun image.
Our Sactionals product line currently represents a majority of our sales. Sactionals are a couch system that consists of two components, seats and sides, which can be arranged, rearranged and expanded into thousands of configurations easily and without tools. Our Sactional products include a number of patented features relating to their geometry and modularity, coupling mechanisms and other features. Our Sactionals represented 72.5% of our sales for fiscal 2019 (or $120.2 million) as compared to 71.3% of sales for fiscal 2018 (or $72.6 million). We believe that these high quality premium priced products enhance our brand image and customer loyalty and expect them to continue to garner a significant share of our sales.
Sacs and Sactionals come in a wide variety of colors and fabrics that allow consumers to customize their purchases in numerous configurations and styles. We provide lifetime warranties on our Sactionals frames and the foam used in both product lines, and 3-year warranties on our covers. Our Designed for Life trademark reflects our dynamic product line that is built to last and evolve throughout a customer’s life. Customers can continually update their Sacs and Sactionals with new covers, additions and configurations to accommodate changes in their family and housing situations.
We believe that our products complement one another and have generated a loyal customer base, evidenced by our recent estimate that 38% of our transactions in fiscal 2019 were from repeat customers. We believe the strength of our brand is reflected in the number of customers who routinely share their purchases of Lovesac products with their friends through social media, often displaying our logos or company name in their posts. Our customers include celebrities and other influencers who support our brand through postings made on an uncompensated and unsolicited basis. As of [l], 2019, we had approximately [l] followers on Facebook and [l] followers on Instagram.
We currently market and sell our products in over 75 showrooms at top tier malls, lifestyle centers and street locations in 30 states in the United States. Our modern, efficient showrooms are designed to appeal to millennials and other purchasers looking for comfortable, enduring, premium furniture. They showcase the different sizes of our Sacs, the myriad forms into which our Sactionals can be configured, and the large variety of fabrics that can be used to cover our products. Our retail showrooms are technology driven and focused on educating prospective customers about the many benefits of our unique products, enabling us to require just 506 to 1,350 square feet for each showroom.
As part of our direct to consumer sales approach, we also sell our products through our fast growing ecommerce platform. We believe our products are uniquely suited to this channel. Our foam-based Sacs can be reduced to one-eighth of their normal size and each of our Sactionals components weighs less than 50 pounds upon shipping. With furniture especially suited to ecommerce applications, our sales completed through this channel accounted for 19.9% of our total sales for fiscal 2019, up from 18.5% for fiscal 2018. Our showrooms and other direct advertising and marketing efforts work in concert to drive customer conversion in ecommerce.
Despite the increase in sales of both our Sacs and Sactionals, net losses were $6.7 million for fiscal 2019 and $5.5 million for fiscal 2018, primarily due to increased spending on showrooms, advertising, marketing and financing related costs.
40
Product Overview
We challenge the notion that a piece of furniture is static by offering a dynamic product line built to last and evolve throughout a customer’s life. Our products serve as a set of building blocks that can be rearranged, restyled and re-upholstered with any new setting, mitigating constant changes in fashion and style.
Sactionals. We believe our Sactionals platform is unlike competing products in its adaptability yet is comparable aesthetically to similarly priced premium couches and sectionals. Our Sactional products include a number of patented features relating to their geometry and modularity, coupling mechanisms and other features. Utilizing only two, standardized pieces, “seats” and “sides,” and over 250 high quality, tight-fitting covers that are removable, washable, and changeable, customers can create numerous permutations of a sectional couch with minimal effort. Customization is further enhanced with our specialty-shaped modular offerings, such as our wedge seat and roll arm side. Our custom features and accessories can be added easily and quickly to a Sactional to meet endless design, style and utility preferences, reflecting our Designed for Life philosophy. Sactionals are built to meet the highest durability and structural standards applicable to fixed couches. Sactionals are comprised of standardized units and we guarantee their compatibility over time, which we believe is a major pillar of their value proposition to the consumer.
Sacs. We believe that our Sacs product line is a category leader in oversized beanbags. The Sac product line offers 6 different sizes ranging from 22 pounds to 95 pounds with capacity to seat 3+ people on the larger model Sacs. Filled with Durafoam, a blend of shredded foam, Sacs provide serene comfort and guaranteed durability. Their removable covers are machine washable and may be easily replaced with a wide selection of cover offerings.
Accessories. Our accessories complement our Sacs and Sactionals by increasing their adaptability to meet evolving consumer demands and preferences. Our current product line offers Sactional-specific drink holders, footsac blankets, decorative pillows, fitted seat tables and ottomans in varying styles and finishes, providing our customers with the flexibility to customize their furnishings with decorative and practical add-ons to meet evolving style preferences. We are in the process of developing additional accessories for the tech-savvy consumer.
Sales Channels
Lovesac offers its products through an inventory lean omni-channel platform that provides a seamless and meaningful experience to our customers in showrooms and online. In recent periods, we have increased our focus on providing a platform for the transaction of business online through digital and mobile applications. As consumers increasingly transact via various ecommerce channels, we believe our robust and user-friendly technological platform is well positioned to benefit from this growth. Additionally, our products’ compact packaging facilitates production scheduling, lower shipping costs and the outsourcing of our shipping function to nationwide express couriers, allowing us to quickly and cost-effectively deliver online orders.
We leverage our showroom as both a traditional retail channel to purchase our products and an educational center for prospective online customers to learn about and interact with our products in real time. Compared to traditional retailers, our showrooms require significantly less square footage because we need to maintain only a few sample seats, sides and Sacs to demonstrate numerous configurations. Warehouse space is minimized by our ability to stack our inventory for immediate sale. In addition to providing a compelling customer experience, we believe that our showroom model provides a more efficient use of capital and logistical advantages over our competitors.
Throughout fiscal 2019, we had an ongoing working relationship with Costco to operate “roadshows” in Costco’s stores, which we refer to as shop in shops. Our shop in shops display select Sacs and Sactionals and are staffed similarly to our more traditional showrooms with associates trained to demonstrate and sell our products and promote our brand.
Factors Affecting Our Operating Results
While our growth strategy has contributed to our improving operating results, it also presents significant risks and challenges. These strategic initiatives will require substantial expenditures. The timing and magnitude of new showroom openings, existing showroom renovations, and marketing activities may affect our results of operations in future periods.
41
Other factors that could affect our results of operations in future periods include:
Overall Economic Trends
The industry in which we operate is cyclical. In addition, our revenues are affected by general economic conditions. Purchases of our products are sensitive to a number of factors that influence the levels of consumer spending, including economic conditions, consumer disposable income, housing market conditions, consumer debt, interest rates and consumer confidence.
Seasonality
Our business is seasonal. As a result, our revenues fluctuate from quarter to quarter, which often affects the comparability of our results between periods. Net sales are historically higher in the fourth fiscal quarter due primarily to the impact of the holiday selling season.
Competition
The retail industry is highly competitive and retailers compete based on a variety of factors, including design, quality, price and customer service. Levels of competition and the ability of our competitors to attract customers through competitive pricing or other factors may impact our results of operations.
How We Assess the Performance of Our Business
In assessing the performance of our business, we consider a variety of financial and operating measures, including the following:
Net sales
Net sales reflect our sale of merchandise plus shipping and handling revenue collected from our customers, less returns and discounts. Sales made at Company operated showrooms, including shop in shops, are recognized at the point of sale when payment is tendered and ownership is transferred to the customer, which may occur subsequent to the sale. Sales of merchandise via the internet are recognized upon receipt and verification of payment and shipment of the merchandise to the customer. We expect to continue to experience healthy growth in net sales and web-based sales to increase as a percentage of total sales. For fiscal 2020, we intend to drive total net sales growth for the full year between 40% and 45%. We intend to open between 15-20 new showrooms and remodel eight showrooms. We intend to operate approximately 690 shop in shops with more than 75% of the shop in shops occurring in the first three quarters of the fiscal year.
Comparable Showroom Sales
Comparable showroom sales are calculated based on showrooms that were open at least fifty-two weeks as of the end of the reporting period. A showroom is not considered a part of the comparable showroom sales base if the square footage of the showroom changed or if the showroom was relocated. If a showroom was closed for any period of time during the measurement period, that showroom is excluded from comparable showroom sales. For fiscal years 2019 and 2018, 14 and 6 showrooms, respectively were excluded from comparable showroom sales. Comparable showroom sales allow us to evaluate how our showroom base is performing by measuring the change in period-over-period net sales in showrooms that have been open for twelve months or more. While we review comparable showroom sales as one measure of our performance, this measure is less relevant to us than it may be to other retailers due to our fully integrated, omni-channel, go-to-market strategy. As a result, measures that analyze a single channel are less indicative of the performance of our business than they might be for other companies that operate their distribution channels as separate businesses. Further, certain of our competitors and other retailers calculate comparable showroom sales (or similar measures) differently than we do. As a result, the reporting of our comparable showroom sales may not be comparable to sales data made available by other companies.
42
Customer Lifetime Value and Customer Acquisition Cost
We calculate CAC on an annual basis by dividing our expenses associated with acquiring new customers for a fiscal year by the number of new customers we acquire in that fiscal year. We include premium rent for locations above commercial rates, media costs to new customers, and a portion of showroom merchandising costs in our marketing expenses associated with acquiring new customers when calculating our CAC. We believe that fiscal 2018 is the first fiscal year that our CAC fully reflects the implementation of changes to our marketing. In fiscal 2018 we significantly increased our spending on marketing expenses and media costs. Our marketing expenses for fiscal 2019 were equal to 11.1% of revenue as compared to 9.0% of revenue for fiscal 2018. For fiscal 2019, our CAC was $309.46 per customer compared to a CAC of $283.22 for fiscal 2018. This increase was a result of our increased marketing spend that targeted Sactional customers. We expect our CAC to continue to increase over the next few years as a result of our continued focus on increasing marketing efforts. We expect this increase in CAC to correspond with a continued increase in CLV.
We monitor repeat customer transactions in aggregate and in groups based upon the year in which customers first made a purchase from us, which we refer to as cohorts, as a way to measure our customers’ engagement with our products over their lifetime. Our fiscal 2019 cohort’s CLV was $1,540. In addition, our fiscal 2015 cohort increased its CLV from $1,071 in fiscal 2015 to $1,277 in fiscal 2019, a 19% increase in CLV since the fiscal 2015 cohort’s first purchases from Lovesac.
Retail Sales Per Selling Square Foot
Retail sales per selling square foot is calculated by dividing total net sales for all showrooms, comparable and non-comparable, by the average selling square footage for the period. Selling square footage is retail space at our showrooms used to sell our products. Selling square footage excludes backrooms at showrooms used for storage, office space or similar matters.
Cost of merchandise sold
Cost of merchandise sold includes the direct cost of sold merchandise; inventory shrinkage; inventory adjustments due to obsolescence, including excess and slow-moving inventory and lower of cost or net realizable value reserves; inbound freight; all freight costs to ship merchandise to our showrooms; design, buying and allocation costs; and all logistics costs associated with shipping product to our customers. Certain of our competitors and other retailers may report gross profit differently than we do, by excluding from gross profit some or all of the costs related to their distribution network and instead including them in selling, general and administrative expenses. As a result, the reporting of our gross profit and profit margin may not be comparable to other companies.
The primary drivers of our cost of merchandise sold are raw materials costs, labor costs in the countries where we source our merchandise, and logistics costs. We expect gross profit to increase to the extent that we successfully grow our net sales and continue to realize scale economics with our manufacturing partners. We review our inventory levels on an ongoing basis in order to identify slow-moving merchandise and use product markdowns to efficiently sell these products. The timing and level of markdowns are driven primarily by customer acceptance of our merchandise.
In addition, we offer financing for our products through a leading third party consumer financing company. Although we do not assume credit risk on these purchases, we do pay fees to these third party lenders, resulting in lower operating margins on these sales than non-financed sales.
Gross Profit
Gross profit is equal to our net sales less cost of merchandise sold. Gross profit as a percentage of our net sales is referred to as gross margin. In September 2018, the Office of the U.S. Trade Representative began imposing a 10 percent ad valorem duty on a subset of products imported from China, inclusive of various furniture product categories. Looking ahead, we expect fiscal 2020 gross profit margin to be 3% lower than fiscal 2019 gross profit margin as a result of the continued expected impact of product and margin shift, tariffs and investments into warehousing and distribution infrastructure to support growth. We are seeking to mitigate the 10% tariff in total dollars but it is expected to have an impact on gross margin as a percentage of net sales. Given the ramp up of our tariff mitigation strategies we expect the first quarter of fiscal 2020 to face the most pressure with a gross margin decline of over 3.5%.
43
Selling, General and Administrative Expenses
Selling, general and administrative expenses include all operating costs, other than marketing expense, not included in cost of merchandise sold. These expenses include all payroll and payroll-related expenses; showroom expenses, including occupancy costs related to showroom operations, such as rent and common area maintenance; occupancy and expenses related to many of our operations at our headquarters, including utilities; Selling, general and administrative expenses as a percentage of net sales is usually higher in lower volume quarters and lower in higher volume quarters because a significant portion of the costs are relatively fixed.
Our recent revenue growth has been accompanied by increased selling, general and administrative expenses. The most significant components of these increases are payroll and rent costs. We expect these expenses, as well as rent expense associated with the opening of new showrooms, to increase as we grow our business. We expect to leverage, or decrease, total selling, general and administrative expenses as a percentage of sales (also referred to as “expense leveraging”) as sales volumes continue to grow. We expect to invest in infrastructure over the next 18 months to support the Company’s growth. These investments will lessen the impact of expense leveraging during the period of investment with the greater impact of expense leveraging happening after the periods in which these investment are made. However, despite these planned investments, we expect expense leveraging to occur over the next 18 months, with deleveraging (or an increase in total selling, general and administrative expenses as a percentage of sales) expected to occur in the first three quarters of the fiscal year, and expense leveraging expected to occur in the fourth quarter.
As a result of our IPO, we incurred additional legal, accounting and other expenses that we did not incur as a private company, including costs associated with public company reporting and corporate governance requirements. These requirements include compliance with the Sarbanes-Oxley Act of 2002, the Dodd-Frank Wall Street Reform and Consumer Protection Act, other rules implemented by the SEC and applicable Nasdaq stock exchange rules. These rules and regulations have substantially increased our legal and financial compliance costs, made certain financial reporting and other activities more time-consuming and costly, and have required our management and other personnel to devote substantial time to these requirements. In this regard, we have hired additional accounting and financial staff with appropriate public company experience and technical accounting knowledge.
Advertising and Marketing
Advertising and marketing expense includes digital, social, and traditional marketing initiatives, that cover all of our business channels. Advertising and marketing expense will continue to increase as a percentage of sales as we continue to invest in advertising and marketing which has accelerated sales growth. We expect to continue to maintain our advertising and marketing investments at 10%-12% of net sales on an annual basis with the most deleverage occurring in the first quarter and greatest leverage occurring in the fourth. The investment by quarter may vary greatly.
Basis of Presentation and Results of Operations
The following discussion contains references to fiscal years 2019 and 2018 which represent our fiscal years ended February 3, 2019, and February 4, 2018, respectively. Our fiscal year ends on the Sunday closest to February 1. Fiscal year 2019 was 52 week period and fiscal 2018 was a 53 week period.
44
The following table sets forth, for fiscal 2019 and fiscal 2018, our consolidated statement of operations data as a percentage of net sales:
| Fiscal Year Ended | ||||||||
| February 3, 2019 | February 4, 2018 | |||||||
| Statement of Operations Data: | ||||||||
| Net sales | 100 | % | 100 | % | ||||
| Cost of merchandise sold | 45 | % | 44 | % | ||||
| Gross margin | 55 | % | 56 | % | ||||
| Selling, general and administrative expenses | 46 | % | 49 | % | ||||
| Advertising and marketing | 11 | % | 9 | % | ||||
| Depreciation and amortization | 2 | % | 2 | % | ||||
| Loss from operations | -4 | % | -5 | % | ||||
| Interest income (expense) | 0 | % | 0 | % | ||||
| Loss before income taxes | -4 | % | -5 | % | ||||
| Income tax expense (benefit) | 0 | % | 0 | % | ||||
| Net loss | -4 | % | -5 | % | ||||
Fiscal 2019 Compared to Fiscal 2018
Net sales
Net sales increased $ 64.1 million, or 62.9%, to $ 165.9 million in fiscal 2019 compared to $101.8 million in fiscal 2018. The increase in net sales is primarily due to an increase in new customers, which grew by 24.7% in fiscal 2019 as compared to 24.1% in fiscal 2018 and was accompanied by an increase in the total number of units sold by approximately 26.3%. The fiscal 2019 average net sales per showroom was $1,568,581, which reflects a higher average order volume per customer. We had 75 and 66 showrooms open as of February 3, 2019 and February 4, 2018, respectively. We opened 13 additional showrooms and closed 4 showrooms in fiscal 2019. Showroom sales increased $35.3 million, or 45.3%, to $113.1 million in fiscal 2019 compared to $77.8 million in fiscal 2018. This increase was due in large part to our comparable showroom sales increase of $24.1 million, or 35.2%, to $92.6 million in fiscal 2019 compared to $68.5 million in fiscal 2018. Retail sales per selling square foot increased $351, or 27.8%, to $1,613 in fiscal 2019 compared to $1,262 in fiscal 2018. Internet sales (sales made directly to customers through our ecommerce channel) increased $14.2 million, or 75.2%, to $33.0 million in fiscal 2019 compared to $18.9 million in fiscal 2018. We believe that the increase in both showroom and Internet sales was due primarily to our customers’ favorable reaction to our Sactionals products, the redesign of our showrooms and our increased marketing initiatives. We believe that the increase in showroom sales in fiscal 2019 can also be attributed to the opening of additional showrooms. Other sales, which include shop in shop sales, increased $14.6 million, or 286.2%, to $19.8 million in fiscal 2019 compared to $5.1 million in fiscal 2018. This increase was due in large part to our increase in the use of shop in shops.
Gross profit
Gross profit increased $ 33.7 million, or 58.8%, to $ 90.9 million in fiscal 2019 from $57.2 million in fiscal 2018. Gross margin decreased to 54.8% of net sales in fiscal 2019 from 56.2% of net sales in fiscal 2018. The decrease in gross margin percentage of 1.4 % was driven primarily by product mix as well as channel mix and higher freight costs as a percentage of net sales.
The decrease in gross margin was partially offset by reduced costs of our Sactionals and Sacs products. The decrease in costs of our Sactionals and Sacs products was primarily related to cost savings from a change in the sourcing of our Lovesoft and down blend fills and volume rebates we received from certain vendors.
Selling, general and administrative expenses
Selling, general and administrative expenses increased $25.6 million, or 50.3%, to $76.4 million for fiscal year 2019 compared to $50.8 million for fiscal year 2018. The increase in selling, general and administrative expenses was primarily related to an increase in employment costs of $3.9 million, $4.5 million of increased rent associated with our net addition of 9 showrooms, $10.6 million of expenses related to the increase in sales such as $2.2 million of credit card fees, $0.8 million of showroom and web related selling expenses, $1.1 million of web affiliate program and web platform hosting commissions and $6.5 million of shop in shop sales agent fees. Overhead expenses increased $2.2 million to support Company initiatives and public company expenses, stock-based compensation increased $2.4 million and $1.9 million of expenses were related to capital raises. Selling, general and administrative expenses were 46.1% of net sales for fiscal year 2019 compared to 49.9% of net sales for fiscal year 2018. The decrease in selling, general and administrative expenses of 3.8% of net sales was driven largely by leverage in employment costs and rent expense. The leverage in these expenses was partially offset by increases in stock compensation, public company costs, infrastructure investments and IPO and other financing initiative costs. We expect to leverage total selling, general and administrative expenses as a percentage of sales as sales volumes continue to grow. We expect to invest in infrastructure over the next 18 months to support the Company’s growth. We believe these investments will lessen the impact of expense leveraging during the period of investment with the greater impact of expense leveraging happening after the periods in which these investments are made.
45
Advertising and marketing
Advertising and marketing expenses increased $9.2 million, or 99.8%, to $18.4 million for fiscal 2019 compared to $9.2 million for fiscal 2018. The increase in advertising and marketing costs relates to increased media and direct to consumer programs which are expected to drive revenue beyond the period of the expense. We expect to continue to maintain our advertising and marketing investments at 10%-12% of net sales on an annual basis. The investment by quarter may vary.
Advertising and marketing expenses were 11.1% of net sales in fiscal 2019 compared to 9.0% of net sales in fiscal 2018. The increase in advertising and marketing expenses of 2.1% of net sales was driven largely by the investment in advertising and marketing initiatives in fiscal 2019, including Labor Day and holiday national advertising.
Depreciation and amortization expenses
Depreciation and amortization expenses increased $0.9 million, or 41.5%, in fiscal 2019 to $3.1 million compared to $2.2 million in fiscal 2018. The increase in depreciation and amortization expense is principally related to capital investments for new and remodeled showrooms.
Interest income (expense), net
Interest income (expense), net of $0.4 million reflects earnings related to the net proceeds from the IPO of $0.6 million net of interest expense of $0.2 million relating to unused line fees, interest on borrowings and amortization of deferred financing fees on the asset based loan for fiscal 2019. The decrease in interest expense from the prior year was the result of no borrowings under the line of credit and interest income earned on the net proceeds from the initial public offering.
Income tax expense
Income tax expense was less than 0.1% of sales for both fiscal 2019 and fiscal 2018.
Repeat customers
Repeat customers accounted for approximately 38% of all transactions in fiscal 2019 and 39% in fiscal 2018. We expect this shift into new customer transactions to continue as we focus on driving acquisition due to our favorable CAC/CLV ratio.
46
Quarterly Results and Seasonality
The following table sets forth our historical quarterly consolidated statements of income for each of the last eight fiscal quarters for fiscal 2019. This unaudited quarterly information has been prepared on the same basis as our annual audited financial statements appearing elsewhere in this prospectus and includes all adjustments, consisting of only normal recurring adjustments that we consider necessary to present fairly the financial information for the fiscal quarters presented. The unaudited quarterly data should be read in conjunction with our audited consolidated financial statements and the related notes appearing elsewhere in this prospectus.
| Thirteen weeks ended | Thirteen weeks ended | Thirteen weeks ended | Thirteen weeks ended | Fourteen weeks ended | Thirteen weeks ended | Thirteen weeks ended | Thirteen weeks ended | |||||||||||||||||||||||||
| February 3, 2019 | November 4, 2018 | August 5, 2018 | May 6, 2018 | February 4, 2018 | October 29, 2017 | July 30, 2017 | April 30, 2017 | |||||||||||||||||||||||||
| Net sales | $ | 64,177,558 | $ | 41,685,929 | $ | 33,249,012 | $ | 26,768,798 | $ | 39,041,375 | $ | 24,391,450 | $ | 20,745,349 | $ | 17,632,239 | ||||||||||||||||
| Cost of merchandise sold | 28,669,301 | 18,799,108 | 15,410,443 | 12,121,625 | 16,111,276 | 10,724,293 | 9,213,593 | 8,544,099 | ||||||||||||||||||||||||
| Gross profit | 35,508,257 | 22,886,821 | 17,838,570 | 14,647,173 | 22,930,099 | 13,667,157 | 11,531,756 | 9,088,140 | ||||||||||||||||||||||||
| Operating expenses | ||||||||||||||||||||||||||||||||
| Selling, general and administrative expenses | 21,448,783 | 19,329,422 | 20,454,183 | 15,194,504 | 16,128,851 | 12,095,035 | 11,575,057 | 10,904,679 | ||||||||||||||||||||||||
| Advertising and marketing | 5,196,137 | 5,164,699 | 3,594,868 | 4,407,787 | 3,416,847 | 2,798,467 | 1,953,130 | 1,023,915 | ||||||||||||||||||||||||
| Depreciation and amortization | 620,742 | 1,084,180 | 758,684 | 670,145 | 837,543 | 835,819 | 338,534 | 347,108 | ||||||||||||||||||||||||
| Total operating expenses | 27,265,662 | 25,578,301 | 24,807,735 | 20,272,436 | 20,383,241 | 15,729,321 | 13,866,721 | 12,275,702 | ||||||||||||||||||||||||
| Operating income (loss) | 8,242,595 | (2,691,480 | ) | (6,969,165 | ) | (5,625,263 | ) | 2,546,858 | (2,062,164 | ) | (2,334,965 | ) | (3,187,562 | ) | ||||||||||||||||||
| Interest income (expense) | 212,922 | 200,862 | (435 | ) | (57,985 | ) | (94,210 | ) | (114,667 | ) | (79,342 | ) | (149,746 | ) | ||||||||||||||||||
| Income (loss) before income taxes | 8,455,517 | (2,490,618 | ) | (6,969,600 | ) | (5,683,247 | ) | 2,452,648 | (2,176,831 | ) | (2,414,307 | ) | (3,337,308 | ) | ||||||||||||||||||
| Income tax provision | 16,407 | - | - | - | 26,000 | - | - | - | ||||||||||||||||||||||||
| Net income (loss) | $ | 8,439,110 | $ | (2,490,618 | ) | $ | (6,969,600 | ) | $ | (5,683,247 | ) | $ | 2,426,648 | $ | (2,176,831 | ) | $ | (2,414,307 | ) | $ | (3,337,308 | ) | ||||||||||
47
| Thirteen weeks ended | Thirteen weeks ended | Thirteen weeks ended | Thirteen weeks ended | Fourteen weeks ended | Thirteen weeks ended | Thirteen weeks ended | Thirteen weeks ended | |||||||||||||||||||||||||
| February 3, 2019 | November 4, 2018 | August 5, 2018 | May 6, 2018 | February 4, 2018 | October 29, 2017 | July 30, 2017 | April 30, 2017 | |||||||||||||||||||||||||
| Net sales | 100 | % | 100 | % | 100 | % | 100 | % | 100 | % | 100 | % | 100 | % | 100 | % | ||||||||||||||||
| Cost of merchandise sold | 45 | % | 45 | % | 46 | % | 45 | % | 41 | % | 44 | % | 44 | % | 48 | % | ||||||||||||||||
| Gross profit | 55 | % | 55 | % | 54 | % | 55 | % | 59 | % | 56 | % | 56 | % | 52 | % | ||||||||||||||||
| Selling, general and administrative expenses | 33 | % | 46 | % | 61 | % | 57 | % | 41 | % | 50 | % | 56 | % | 62 | % | ||||||||||||||||
| Advertising and marketing | 8 | % | 12 | % | 11 | % | 16 | % | 9 | % | 11 | % | 9 | % | 6 | % | ||||||||||||||||
| Depreciation and amortization | 1 | % | 3 | % | 2 | % | 3 | % | 2 | % | 3 | % | 2 | % | 2 | % | ||||||||||||||||
| Total operating expenses | 42 | % | 61 | % | 74 | % | 76 | % | 52 | % | 64 | % | 67 | % | 70 | % | ||||||||||||||||
| Operating income (loss) | 13 | % | -6 | % | -20 | % | -21 | % | 7 | % | -8 | % | -11 | % | -18 | % | ||||||||||||||||
| Interest income (expense) | 0 | % | 0 | % | 0 | % | 0 | % | -1 | % | -1 | % | -1 | % | -1 | % | ||||||||||||||||
| Income (loss) before income taxes | 14 | % | -6 | % | -20 | % | -21 | % | 6 | % | -9 | % | -12 | % | -19 | % | ||||||||||||||||
| Income tax provision | 0 | % | 0 | % | 0 | % | 0 | % | 0 | % | 0 | % | 0 | % | 0 | % | ||||||||||||||||
| Net income (loss) | 13 | % | -6 | % | -20 | % | -21 | % | 6 | % | -9 | % | -12 | % | -19 | % | ||||||||||||||||
Non-GAAP Quarterly Results
| Thirteen weeks ended | Thirteen weeks ended | Thirteen weeks ended | Thirteen weeks ended | Fourteen weeks ended | Thirteen weeks ended | Thirteen weeks ended | Thirteen weeks ended | |||||||||||||||||||||||||
| February 3, 2019 | November 4, 2018 | August 5, 2018 | May 6, 2018 | February 4, 2018 | October 29, 2017 | July 30, 2017 | April 30, 2017 | |||||||||||||||||||||||||
| Net income (loss) | $ | 8,439,110 | $ | (2,490,618 | ) | $ | (6,969,600 | ) | $ | (5,683,247 | ) | $ | 2,426,648 | $ | (2,176,831 | ) | $ | (2,414,307 | ) | $ | (3,337,308 | ) | ||||||||||
| Interest (income) expense | $ | (212,922 | ) | $ | (200,862 | ) | $ | 435 | $ | 57,985 | 94,210 | 114,667 | 79,342 | 149,746 | ||||||||||||||||||
| Provision for income taxes | 16,407 | - | - | - | 26,000 | - | - | - | ||||||||||||||||||||||||
| Depreciation and amortization | 620,742 | 1,084,180 | 758,684 | 670,145 | 837,543 | 835,819 | 338,534 | 347,108 | ||||||||||||||||||||||||
| Deferred rent | 148,354 | 130,710 | 128,398 | 123,244 | 117,900 | 102,812 | 72,071 | 67,046 | ||||||||||||||||||||||||
| Stock based compensation | 460,176 | 516,000 | 2,038,865 | 295,239 | 935,345 | 15,209 | - | - | ||||||||||||||||||||||||
| Write-off of property and equipment | 248,581 | - | - | 6,139 | 196,540 | - | - | - | ||||||||||||||||||||||||
| Sponsor fees | 185,082 | 125,000 | 742,000 | 125,000 | 125,000 | 125,000 | 125,000 | 108,888 | ||||||||||||||||||||||||
| Other expenses | 70,134 | 444,000 | 1,291,573 | 215,715 | 1,265,583 | 205,011 | 238,597 | 249,457 | ||||||||||||||||||||||||
| Adjusted EBITDA | $ | 9,975,664 | $ | (391,590 | ) | $ | (2,009,645 | ) | $ | (4,189,781 | ) | $ | 6,024,769 | $ | (778,313 | ) | $ | (1,560,763 | ) | $ | (2,415,063 | ) | ||||||||||
48
Our business is seasonal and we have historically realized a higher portion of our net sales and net income in the fourth fiscal quarter due primarily to the holiday selling season. Working capital requirements are typically higher in the third fiscal quarter due to inventory built-up in advance of the holiday selling season. During these peak periods we have historically increased our borrowings under our revolving line of credit. As such, results of a period shorter than a full year may not be indicative of results expected for the entire year, and the seasonal nature of our business may affect comparisons between periods.
Liquidity and Capital Resources
General
Our business relies on cash flows from operations, our revolving line of credit (see “Revolving Line of Credit” below) and securities issuances as our primary sources of liquidity. Our primary cash needs are for marketing and advertising, inventory, payroll, showroom rent, capital expenditures associated with opening new showrooms and updating existing showrooms, as well as infrastructure and information technology. The most significant components of our working capital are cash and cash equivalents, inventory, accounts receivable, accounts payable and other current liabilities and customer deposits. When borrowing, our borrowings generally increase in our third fiscal quarter as we prepare for the holiday selling season, which is in our fourth fiscal quarter. We believe that cash expected to be generated from operations and cash generated from the IPO are sufficient to meet working capital requirements and anticipated capital expenditures for at least the next 12 months. We expect to incur approximately $13.0 million of capital expenditures in fiscal 2020 with the vast majority of this being spent on the opening of 15-20 new showrooms, remodeling eight showrooms and a $3.0 million investment in our vertically operated Sac manufacturing facility. The remaining expenditures are expected to be allocated to technology in our showrooms, inventory management and logistic systems, ecommerce platform enhancements and headquarters data and support systems.
Cash Flow Analysis
A summary of operating, investing, and financing activities during the periods indicated are shown in the following table:
| Fiscal Year Ended | ||||||||
| February 3, | February 4, | |||||||
| 2019 | 2018 | |||||||
| (dollars in thousands) | ||||||||
| Used in operating activities | $ | (7,008 | ) | $ | (2,740 | ) | ||
| Used in investing activities | (11,362 | ) | (6,809 | ) | ||||
| Provided by financing activities | 58,265 | 17,847 | ||||||
| Increase in cash and cash equivalents | 39,896 | 8,297 | ||||||
| Cash and cash equivalents at end of period | 49,071 | 9,176 | ||||||
Net Cash Used in Operating Activities
Cash from operating activities consists primarily of net loss adjusted for certain non-cash items, including depreciation and amortization of property and equipment, loss on disposal of property and equipment, equity-based compensation and deferred rent, and the effect of changes in operating assets and liabilities.
In fiscal 2019, net cash used by operating activities was $7.0 million and consisted of a net loss of $6.7 million, adjustments for certain non-cash items of $7.4 million and changes in operating assets and liabilities of $7.7 million. Changes in operating assets and liabilities consisted primarily of increases in merchandise inventories of $14.5 million and accounts receivable of $1.1 million, partially offset by a decrease in prepaid expenses and other current assets of $0.1 million and increases in accounts payable and accrued expenses of $7.7 million and customer deposits of $0.2 million.
49
In fiscal 2018, net cash used by operating activities was $2.7 million and consisted of a net loss of $5.5 million, adjustments for certain non-cash items of $3.9 million and changes in operating assets and liabilities of $1.1 million. Changes in operating assets and liabilities consisted primarily of increases in merchandise inventories of $2.2 million, prepaid expenses and other current assets of $4.2 million and accounts receivable of $1.8 million, partially offset by increases in accounts payable and accrued expenses of $6.9 million and customer deposits of $0.2 million.
Net Cash Used In Investing Activities
Investing activities consist primarily of investment in supply chain and systems infrastructure and capital expenditures related to new showroom openings and the remodeling of existing showrooms and intangibles.
For fiscal 2019, capital expenditures were $11.4 million as a result of investments in new and remodeled showrooms and intangibles.
For fiscal 2018, capital expenditures were $6.8 million as a result of investments in new and remodeled showrooms and intangibles.
Net Cash Provided By Financing Activities
Financing activities consist primarily of the net proceeds from public offerings, borrowings and repayments related to the existing revolving line of credit and capital contributions from securities issuances.
For fiscal 2019, net cash provided by financing activities was $58.3 million, primarily due to $58.9 million net proceeds from our IPO, $0.4 million of taxes paid for net share settlement of equity awards and of $0.3 million for the payment of deferred financing costs related to our new revolving credit facility with Wells Fargo Bank, National Association (“Wells”).
For fiscal 2018, net cash provided by financing activities was $17.8 million, primarily due to net proceeds from our sale of Series A, Series A-1 and Series A-2 preferred stock, which converted into approximately 3,287,441 shares of our common stock upon the closing of our IPO, partially offset by $3.1 million of paydowns of our line of credit and $0.2 million of principal payments on our note payable.
Revolving Line of Credit
On February 6, 2018, we entered a four-year, secured revolving credit facility with Wells. The credit facility with Wells permits borrowings of up to $25.0 million, subject to borrowing base and availability restrictions. For additional information regarding our line of credit with Wells, see Note 9 to our consolidated financial statements. As of February 3, 2019, the Company’s borrowing availability under the line of credit with Wells was $11.1 million. As of February 3, 2019, there was $31,373 in borrowings outstanding on this line of credit related to unused line charge fees.
Contractual Obligations
We generally enter into long-term contractual obligations and commitments in the normal course of business, primarily debt obligations and non-cancelable operating leases. As of February 3, 2019, our contractual cash obligations over the next several periods were as follows:
| Payments due by period | ||||||||||||||||||||
| Total | Less than 1 year | 1 – 3 years | 3 – 5 Years | More than 5 Years | ||||||||||||||||
| Employment agreements | $ | 2,905,640 | $ | 2,905,640 | $ | - | $ | - | $ | - | ||||||||||
| Operating leases | 61,128,965 | 9,350,423 | 16,545,985 | 14,979,073 | 20,253,484 | |||||||||||||||
| Total | $ | 64,034,605 | $ | 12,256,063 | $ | 16,545,985 | $ | 14,979,073 | $ | 20,253,484 | ||||||||||
50
Off Balance Sheet Arrangements
We have no material off balance sheet arrangements as of February 3, 2019, except for operating leases and employment agreements entered into in the ordinary course of business.
Critical Accounting Policies and Estimates
The discussion and analysis of financial condition and results of operations is based upon our consolidated financial statements, which have been prepared in conformity with GAAP. Certain accounting policies and estimates are particularly important to the understanding of our financial position and results of operations and require the application of significant judgment by our management or can be materially affected by changes from period to period in economic factors or conditions that are outside of our control. As a result, they are subject to an inherent degree of uncertainty. In applying these policies, management uses their judgment to determine the appropriate assumptions to be used in the determination of certain estimates. Those estimates are based on our historical operations, our future business plans and projected financial results, the terms of existing contracts, observance of trends in the industry, information provided by our customers and information available from other outside sources, as appropriate. Please see Note 1 to our audited consolidated financial statements included in this prospectus for a complete description of our significant accounting policies. There have been no material changes to the significant accounting policies during fiscal 2019.
Revenue Recognition
Company revenues consist of sales made to consumers at Company operated showrooms and via the internet and also sales made business to business. Sales made at Company operated showrooms are recognized at the point of sale when payment is tendered and ownership is transferred to the customer. Sales of merchandise via the internet are recognized upon receipt and verification of payment and shipment of the merchandise to the customer. Ownership and risk of loss transfer to the customer upon shipment. Sales made to businesses are recognized at the point of shipment when ownership and the risk of loss transfer to the customer. Customer deposits are recorded for sales made for which ownership has not transferred as a result of payment received for goods upon order but not yet shipped at the end of any fiscal accounting period. These deposits are carried on our balance sheet until delivery is fulfilled which is typically within 3 – 4 days of an order being processed.
Recorded net sales provide for estimated returns and allowances. We permit our customers to return products up to 60 days after purchase, depending on the product, along with defective products and incorrect shipments.
The Company has no foreign operations and its sales to foreign countries were less than 0.05% of total net sales in both fiscal 2019 and fiscal 2018.
The Company had no customer in fiscal 2019 or fiscal 2018 that comprised more than 10% of total net sales.
Revenue is recognized net of sales tax collected.
Impairment of Long-Lived Assets
The Company’s long-lived assets consist of property and equipment, which includes leasehold improvements, and other intangible assets. Long-lived assets are reviewed for potential impairment at such time that events or changes in circumstances indicate that the carrying amount of an asset might not be recovered. The Company evaluates long-lived assets for impairment at the individual showroom level, which is the lowest level at which individual cash flows can be identified. When evaluating long-lived assets for potential impairment, the Company will first compare the carrying amount of the assets to future undiscounted cash flows for the respective long-lived asset. If the estimated future cash flows are less than the carrying amounts of the assets, an impairment loss calculation is prepared. An impairment loss is measured based upon the excess of the carrying value of the asset over its estimated fair value which is generally based on an estimate of future discounted cash flows. If required, an impairment loss is recorded for that portion of the asset’s carrying value in excess of fair value. There were no impairments of long-lived assets during fiscal 2019 or fiscal 2018.
Advertising and Catalog Costs
The Company capitalizes direct-response advertising costs, which consist primarily of television advertising, postcards, catalogues and their mailing costs, and recognizes expense over the related revenue stream if the following conditions are met (1) the primary purpose of the advertising is to elicit sales to customers who could be shown to have responded specifically to the advertising, and (2) the direct-response advertising results in probable and estimable future benefits.
51
For the years ended February 3, 2019 and February 4, 2018 the Company capitalized deferred direct-response television, postcard and catalogue costs of approximately $0 and $3,060,029, respectively. The net balance remaining at February 3, 2019 and February 4, 2018, after amortization, was $0 and $1,348,908, respectively.
Direct-response advertising costs, which are included in prepaid expenses and other current assets, are amortized commencing the date the catalogs and post cards are mailed and the television commercial airs through the estimated period of time for the Company has determined the related advertising impacts sales. The entire outstanding balance as of February 4, 2018 was fully amortized in fiscal 2019. There was no balance as of February 3, 2019.
Advertising and marketing costs not associated with direct-response advertising are expensed as incurred. Advertising expenses (including amortization of direct-response advertising) were $16,727,070 in fiscal 2019 and $6,213,603 in fiscal 2018.
Merchandise Inventories
Merchandise inventories are comprised of finished goods and are carried at the lower of cost or net realizable value. Cost is determined on a weighted-average basis. Merchandise inventories consist primarily of foam filled furniture, sectional couches and related accessories. The Company adjusts its inventory for obsolescence based on historical trends, aging reports, specific identification and its estimates of future retail sales prices.
New Accounting Pronouncements
Except as described below, the Company has considered all other recently issued accounting pronouncements and does not believe the adoption of such pronouncements will have a material impact on its financial statements. The Company, as an emerging growth company, has elected to use the extended transition period for complying with new or revised financial accounting standards.
In August 2015, the Financial Accounting Standards Board (“FASB”) issued Accounting Standard Update (“ASU”) No. 2015-14, which defers the effective date of ASU No. 2014-09, Revenue from Contracts with Customers (Topic 606) by one year. ASU 2014-09 is a comprehensive new revenue recognition model requiring a company to recognize revenue to depict the transfer of goods or services to a customer at an amount reflecting the consideration it expects to receive in exchange for those goods or services. As a result, ASU 2015-14 is now effective for fiscal years, and interim periods within those years, beginning after December 15, 2018, which for us is fiscal 2020. Earlier application is permitted. The Company will adopt the guidance for the annual reporting period beginning in the first quarter of fiscal 2020 using the modified retrospective method. The Company has evaluated and continues to evaluate the impact of the adoption of the new revenue recognition standard. The adoption of this standard will not have a material impact on the Company’s financial position and results of operations other than the need for increased disclosure.
In February 2016, FASB issued ASU No. 2016-02, Leases (Topic 842) amending lease guidance to increase transparency and comparability among organizations by recognizing lease assets and lease liabilities on the balance sheet and disclosing key information about leasing arrangements. ASU No. 2016-02 is effective for fiscal years beginning after December 15, 2019, and interim periods within fiscal years beginning after December 15, 2020, with early adoption permitted. Management is currently evaluating the impact ASU No. 2016-02 will have on these consolidated financial statements.
In August 2016, FASB issued ASU 2016-15, Statement of Cash Flows: Clarification of Certain Cash Receipts and Cash Payments, which eliminates the diversity in practice related to classification of certain cash receipts and payments in the statement of cash flows, by adding or clarifying guidance on eight specific cash flow issues. ASU 2016-15 is effective for fiscal years beginning after December 15, 2018, and interim periods within fiscal years beginning after December 15, 2019, which for the Company is fiscal 2020. Early adoption is permitted, including adoption in an interim period. The Company has not yet determined the effect of the adoption of ASU 2016-15 on the Company’s consolidated financial position and results of operations.
52
Quantitative and Qualitative Disclosure of Market Risks
Interest Rate Risk
We are subject to interest rate risk under our revolving line of credit. All amounts outstanding under the revolving credit line accrue interest at the base rate, which is defined as the greatest of (i) Prime Rate published by The Wall Street Journal, (ii) Federal Funds Rate plus 0.5% or (iii) 3.25%, plus 3% ([●] at February 3, 2019 and 7.25% at February 4, 2018). If the Federal Funds Rate increases, our payments under the revolving credit line will increase. We do not believe that an increase or decrease in interest rates of 100 basis points would have a material effect on our operating results or financial condition.
Impact of Inflation
Our results of operations and financial condition are presented based on historical cost. While it is difficult to accurately measure the impact of inflation due to the imprecise nature of the estimates required, we believe the effects of inflation, if any, on our results of operations and financial condition have been immaterial. We cannot assure you that our business will not be affected in the future by inflation.
Internal Control Over Financial Reporting
The process of improving our internal controls has required and will continue to require us to expend significant resources to design, implement and maintain a system of internal controls that is adequate to satisfy our reporting obligations as a public company. There can be no assurance that any actions we take will be completely successful. We will continue to evaluate the effectiveness of our disclosure controls and procedures and internal control over financial reporting on an ongoing basis.
We have begun testing and documenting our internal control procedures in order to comply with the requirements of Section 404 of SOX. Section 404(a) requires annual management assessments of the effectiveness of our internal control over financial reporting and Section 404(b) requires a report by our independent auditors addressing these assessments. We must comply with Section 404(a) beginning with the fiscal year ending February 2020 and we must comply with Section 404(b) no later than the time we file our annual report for fiscal 2023 with the SEC. We anticipate retaining additional personnel to assist us in complying with our Section 404 obligations. We are currently evaluating whether such personnel will be retained as consultants or as our employees.
53
Company Overview
We are a technology driven, omni-channel company that designs, manufactures and sells unique, high quality furniture comprised of modular couches called Sactionals and premium foam beanbag chairs called Sacs. We market and sell our products through modern and efficient showrooms and, increasingly, through online sales. We believe that our ecommerce centric approach, coupled with our ability to deliver our large upholstered products through nationwide express couriers, is unique to the furniture industry.
The name “Lovesac” was derived from our original innovative product, a premium foam beanbag chair, the Sac. The Sac was developed in 1995 and provided the foundation for the Company. Sales of this product have been increasing, representing $41.2 million for fiscal 2019, as compared to $26.9 million for fiscal 2018. We believe that the large size, comfortable foam filling and irreverent branding of our Sacs products have been instrumental in growing a loyal customer base and our positive, fun image.
Our Sactionals product line currently represents a majority of our sales. Sactionals are a couch system that consists of two components, seats and sides, which can be arranged, rearranged and expanded into thousands of configurations easily and without tools. Our Sactional products include a number of patented features relating to their geometry and modularity, coupling mechanisms and other features. Our Sactionals represented 72.5% of our sales for fiscal 2019 (or $120.2 million) as compared to 71.3% of sales for fiscal 2018 (or $72.6 million). We believe that these high quality premium priced products enhance our brand image and customer loyalty and expect them to continue to garner a significant share of our sales.
Sacs and Sactionals come in a wide variety of colors and fabrics that allow consumers to customize their purchases in numerous configurations and styles. We provide lifetime warranties on our Sactionals frames and the foam used in both product lines, and 3-year warranties on our covers. Our Designed for Life trademark reflects our dynamic product line that is built to last and evolve throughout a customer’s life. Customers can continually update their Sacs and Sactionals with new covers, additions and configurations to accommodate changes in their family and housing situations.
We believe that our products complement one another and have generated a loyal customer base, evidenced by our recent estimate that 38% of our transactions in fiscal 2019 were from repeat customers. We believe the strength of our brand is reflected in the number of customers who routinely share their purchases of Lovesac products with their friends through social media, often displaying our logos or company name in their posts. Our customers include celebrities and other influencers who support our brand through postings made on an uncompensated and unsolicited basis. As of [●], 2019, we had approximately [●] followers on Facebook and [●] followers on Instagram.
We currently market and sell our products in over 75 showrooms at top tier malls, lifestyle centers and street locations in 30 states in the United States. Our modern, efficient showrooms are designed to appeal to millennials and other purchasers looking for comfortable, enduring, premium furniture. They showcase the different sizes of our Sacs, the myriad forms into which our Sactionals can be configured, and the large variety of fabrics that can be used to cover our products. Our retail showrooms are technology driven and focused on educating prospective customers about the many benefits of our unique products, enabling us to require just 506 to 1,350 square feet for each showroom.
As part of our direct to consumer sales approach, we also sell our products through our fast growing ecommerce platform. We believe our products are uniquely suited to this channel. Our foam-based Sacs can be reduced to one-eighth of their normal size and each of our Sactionals components weighs less than 50 pounds upon shipping. With furniture especially suited to ecommerce applications, our sales completed through this channel accounted for 19.9% of our total sales for fiscal 2019, up from 18.5% for fiscal 2018. Our showrooms and other direct advertising and marketing efforts work in concert to drive customer conversion in ecommerce.
Despite the increase in sales of both our Sacs and Sactionals, net losses were $6.7 million for fiscal 2019 and $5.5 million for fiscal 2018, primarily due to increased spending on showrooms, advertising, marketing and financing related costs.
54
Product Overview
We challenge the notion that a piece of furniture is static by offering a dynamic product line built to last and evolve throughout a customer’s life. Our products serve as a set of building blocks that can be rearranged, restyled and re-upholstered with any new setting, mitigating constant changes in fashion and style. Traditional couches, chairs and sectionals are sold as static products, purchased and used for a current and specific need in the home. As a result, we believe the industry is beholden to the uncertainties of fashion, seasonality, and style, including the accompanying inventory risk.
| ● | Sactionals. We believe our Sactionals platform is unlike competing products in its adaptability, yet is comparable aesthetically to similarly priced premium couches and sectionals. Our Sactional products include a number of patented features relating to their geometry and modularity, coupling mechanisms and other features Utilizing only two, standardized pieces, “seats” and “sides,” and over 250 high quality, tight-fitting covers that are removable, washable, and changeable, customers can create numerous permutations of a sectional couch with minimal effort. Customization is further enhanced with our specialty-shaped modular offerings, such as our wedge seat and roll arm side. Our custom features and accessories can be added easily and quickly to a Sactional to meet endless design, style and utility preferences, reflecting our Designed for Life philosophy. Sactionals are built to meet the highest durability and structural standards applicable to fixed couches. Sactionals are comprised of standardized units and we guarantee their compatibility over time, which we believe is a major pillar of their value proposition to the consumer. |

Sactionals Patented Modular System

55
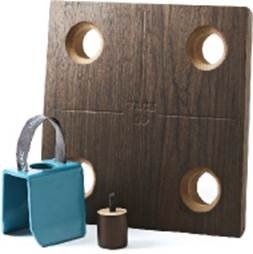

| ● | Sacs. We believe that our Sacs product line is a category leader in oversized beanbags. The Sac product line offers 6 different sizes ranging from 22 pounds to 95 pounds with capacity to seat 3+ people on the larger model Sacs. Filled with Durafoam, a blend of shredded foam, Sacs provide serene comfort and guaranteed durability. Their removable covers are machine washable and may be easily replaced with a wide selection of cover offerings. Sacs are manufactured using patented methods that allow for compression of some components of the Sac product, which facilitates shipping and handling of Sacs. This patented method allows us to shrink the Sac to an eighth of its original volume so that it fits inside a duffle bag. |
56

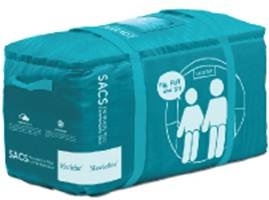
Sac Packaging
| ● | Accessories. Our accessories complement our Sacs and Sactionals by increasing their adaptability to meet evolving consumer demands and preferences. Our current product line offers Sactional-specific drink holders, footsac blankets, decorative pillows, fitted seat tables and ottomans in varying styles and finishes, providing our customers with the flexibility to customize their furnishings with decorative and practical add-ons to meet evolving style preferences. We are in the process of developing additional accessories for the tech-savvy consumer. |
Sales Channels
We offer our products through an omni-channel platform that provides a seamless and meaningful experience to our customers online and in-store. Compared to traditional retailers, our showrooms require significantly less square footage because of our need to have only a few in-store sample configurations for display and our ability to stack our inventory for immediate sale. Our retail showrooms are technology driven and focused on educating prospective customers about the many benefits of our unique products, enabling us to require just 506 to 1,350 square feet for each showroom. The small footprint requirement provides a cost advantage and flexibility in locating our showrooms strategically in A-rated malls and street locations in our target markets. These logistical advantages underlie our broader tech-driven, internet-based business model, where we leverage our showrooms as both a traditional retail channel to purchase our products and an educational center for prospective online customers to learn about and interact with our products in real time.
57
We currently operate over 75 showrooms in 30 states in the United States, with above average productivity, as measured by average sales per square foot, compared to the general home furnishings industry and mall-based retailers, as measured by Furniture Today in a 2016 study. We averaged sales of $[●], in fiscal 2019. We believe our new showroom concept has preliminarily demonstrated performance improvements.
Through our fast growing mobile and ecommerce channel, we are able to significantly enhance the consumer shopping experience for home furnishings, driving deeper brand engagement and loyalty, while simultaneously driving favorable margin expansion. Our technology capabilities are robust, and we are well positioned to benefit from the growing consumer preference to transact via mobile devices. We leverage our strong social media presence and showroom footprint to drive traffic toward our ecommerce platform, where product testimonials and inspirational stories from our Lovesac community create a more engaging consumer experience for our customers. Additionally, our products’ compact packaging facilitates consistent production scheduling, outsourcing of delivery and lower shipping costs, allowing us to quickly and cost-effectively deliver online orders.
We have also enhanced our sales through the use of shop in shops. We have an ongoing working relationship with Costco to operate shop in shop showrooms that typically average ten days at a time. The shop in shop showrooms display select Sacs and Sactionals and are staffed with associates trained to demonstrate and sell our products. We continue to explore other shop in shop partnerships and opportunities to promote our products and facilitate customers interacting with our products in the real world. Other sales which includes shop in shop sales represented approximately 11.9% of sales in fiscal 2019, as compared to 5.0% for fiscal 2018.
Customers
| ● | Robust customer lifetime value. Once customers invest in our products, they tend to stay with them, grow with them, and add to them. We believe our customers’ loyalty is an important driver of our CLV. An example of this is that our fiscal 2015 cohort has increased its CLV by 19.3% since year end fiscal 2015. We calculated our fiscal 2015 CLV by dividing the aggregate gross profits through fiscal 2019 attributable to the 2015 cohort (approximately $41,147,646) by the total number of customers in the 2015 cohort (38,423 customers). | |
| ● | Target Demographics. Based on our internal data, our typical customer is 25 to 45 years in age with an annual household income of over $100,000. We consider this to be an attractive demographic because of its higher than average rates of household formation and furniture purchasing. Members of the millennial demographic, our primary target market, are entering this age group daily. Our customers have different tastes, styles, purchasing goals and budgets when shopping for couches, and our Sactionals platform’s modularity addresses this wide array of needs. |
Our Market
Large and Growing Furniture Retailing Industry
We sell our products in the large and highly fragmented furniture retailing industry, which has been rebounding steadily since the global recession. According to Mintel, a market research firm, consumer furniture expenditures are expected to grow to $127.5 billion in 2021, representing an average annual growth rate of 3.4% between 2016 and 2021. Additionally, Mintel reported that the segment consisting of couches, chairs, and other seating products comprised nearly 30% of all U.S. consumer furniture expenditures in 2015, surpassing the next largest segment, mattresses and sleep equipment, which represented 17% of expenditures.
A Maturing Millennial Population with Favorable Furniture Purchasing Habits
Millennials, our target demographic, have surpassed Baby Boomers as the largest living generation in the United States. The millennial population reached 83.1 million people in 2015, representing more than 25% of the United States. population according to data from the U.S. Census Bureau. Moreover, tech savvy millennials are maturing to an age where their buying power coincides with larger discretionary purchases, including furniture products. Based on a survey conducted by Mintel, 73% of millennials (who Mintel defines as those persons born between 1977 and 1994) purchased furniture between April 2014 and April 2016. According to Mintel, of those purchasing furniture between April 2014 and April 2016, 47% of millennials reported that they had made the purchase online, compared to just 26% for Generation X and 17% for Baby Boomers purchasing furniture during the same period.
58
Emergence of Online Sales in the Furniture Industry
According to eMarketer, retail ecommerce sales of furniture and home furnishings will grow from $36.0 billion in 2017 to $62.4 billion in 2021. In addition, over one-third of furniture consumers have purchased products online, and this percentage is expected to continue to expand, according to Mintel. Driving the market share growth of the online segment are retailers that offer fully supported shopping experiences across their web and mobile platforms. When purchasing their most recent home furnishing product, 30% of consumers made an online purchase using a computer and 9% of consumers made an online purchase using a mobile device according to data from Mintel. While consumers are now more tech savvy and likely to browse for furniture products online, many consumers still prefer to see and feel products in-store before making their purchasing decision. Omni-channel retailers that offer a comprehensive shopping experience across all channels are well positioned to attract the growing portion of consumers who use multiple channels to browse, compare and purchase furniture products.
Connecting with Customers
We take a direct-to-consumer approach to marketing that focuses primarily on digital media and is supported with more traditional marketing tactics, including showrooms to demonstrate the product. We believe that most of our customer interactions involve seeing and researching our products online. The logistical advantages inherent in the packaging and distribution of both Sacs and Sactionals allow us to transact with our customers online or in any one of our various showrooms and deliver anywhere. In either case, we aim to make the overall customer experience the same. Our marketing strategy is to facilitate consumers’ ability to see it, touch it, and purchase it.
Brand Awareness — “See It”
Our internal research indicates that our brand currently has low national awareness. A key element of our marketing strategy, therefore, is on building awareness. Sacs and Sactionals are uniquely suited for display using motion photography in various forms (video, gif, sequence shots, etc.) because of their dynamic nature. Sactionals, unlike most other couch solutions, can move, change and rearrange, thereby enhancing our opportunity to drive awareness to the brand through both online and offline efforts.
| ● | Online marketing. We have focused our online marketing efforts on digital advertising, search engine marketing (“SEM”), earned media, organic social media, paid social media (including targeted Facebook advertising), product placement and influencer marketing that ties back to our website and social media. Each of these approaches is discretely important but we seek for them to work together to drive awareness and lead consumers to consideration and eventually to purchase. | |
| ● | Social media. Our customers are highly engaged in social media, and they actively share stories about their Lovesac product and brand experiences through social media channels. We believe the social media activity around our brand can be viewed as an authentic extension of our culture and value proposition that resonates with the social media generation. Our brand promise of total comfort and transparency is the principle that connects our owner and fan base, which we refer to as our #LovesacFamily. Our followings on all key social media platforms are robust and growing rapidly, with what we believe is a high degree of engagement. | |
| As an example of the opportunity for us to leverage our products’ unique attributes online, in 2016 a video of friends jumping onto a Sac at their workplace went viral, becoming one of the top videos (excluding movie trailers) that received the most views within 24 hours of release across the world, achieving approximately 42 million views within the first 24 hours of posting. As of [●], 2019, the video had been viewed over [●] million times. |
59
| ● | Offline marketing. Our offline marketing efforts include: sampling, direct mail, catalog, showroom, model market media mix approaches and pure direct marketing. Many of these overlap with or tie back to our digital marketing efforts. We track, measure and continually optimize each of these efforts to increase efficiency and extend the reach of the brand. While facilitating new customers’ discovery of the brand and product is the major focus of our marketing efforts, we also employ some of these same tactics to drive repeat business. |
Showroom Footprint — “Touch It”
Furniture is a “considered purchase” due to its big-ticket nature and long term intended use. While Lovesac furniture’s changeability mitigates some of these consequences, it is often the case that consumers wish to touch, try out, or sit on a piece of furniture before they make the investment. Many of our customers first experience Lovesac furniture in the homes of their friends or neighbors. Lovesac showrooms also have proven to be a very effective means to facilitate consumers experiencing our products firsthand. Based on our internal data, customers who have visited our website and a showroom are 59% more likely to purchase online than those customers who have never visited one of our showrooms and have only visited our website. To date, most Lovesac showrooms exist in top tier shopping malls spread across a majority of the United States.
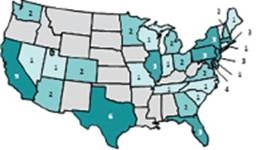 |
 | |
| Showroom Locations | New Showroom Concept |
Ease of the Buying Experience — “Buy It”
We consider ourselves a technology company selling furniture, and an important part of this is our customers’ buying experience. Whether in a showroom, a shop in shop, or at home, most Lovesac product sale transactions happen over a computer tablet or mobile device. For this reason, all of our policies, procedures and systems continue to evolve toward facilitating and accommodating sales through any channel, whether online, mobile or traditional. We seek for our customers to adopt the product platform, integrate it into their lives, share it with friends via social media or in their homes, and continue to grow with us.
The modularity of our products enables dynamic pricing for the first time in home furnishings. Consumers on a budget can start out with just a few seats and sides, building up to larger and larger configurations over time as their needs and ability to pay allow. In addition, we offer financing for our products through a leading third party consumer financing company. Although we do not assume credit risk on these purchases, we do pay fees to these third party lenders, resulting in lower operating margins on these sales than non-financed sales.
60
Competitive Strengths
Our consumers often cross-shop Lovesac with companies such as Crate and Barrel, Pottery Barn, Arhaus, Restoration Hardware, Ikea, Joybird and Wayfair. We believe that the following strengths are central to the power of our brand and business model:
Innovative Business Model
| ● | Merchandising Strategy. Many home furnishings retailers, online or offline, rely on an assortment of new offerings each season to drive their business and to refashion their offerings. We have avoided this “merchandising” approach in favor of a product platform-based approach that reduces the need for seasonal introductions, designer collections, or broad in-stock assortments. We optimize our in-stock assortment of covers and accessories by limiting them to those that sell in large quantity and therefore present lower risk. We also provide a broad assortment of made-to-order items, which we manufacture after the consumer has purchased and paid for them. This business model yields little to no surplus inventory, less margin erosion due to overstock write-downs, higher than average annual inventory turns, increased focus at the showroom management level, and simplicity in merchandising-display execution. | |
| ● | Product Platform Approach. We have two primary platforms upon which we develop, manufacture and sell our fundamental Sacs and Sactionals products. We market our product platforms as a long term investment that our customers can continually update with new arrangements, coverings and accessories. In turn, these changes and updates provide a recurring revenue source for our business. In addition, our Sactionals platform is an environmentally conscious alternative to fixed couches that tend to be discarded when they go out of style or wear out, a by-product of our Designed for Life approach and an important feature to some consumers. | |
| ● | Ecommerce Focus. We build our business processes, systems, compensation structures, and logistical models with an ecommerce-first approach. We continually innovate to make shopping online easier for our customers, and we use social media to drive increased traffic to our web-based sales applications. From a product standpoint, the open-cell nature of the Durafoam filler in our Sacs allows them to be compressed for shipping to one-eighth of their normal size. To facilitate shipping, Sactionals seat cushions and back pillows are compressed to fit inside an otherwise hollow hardwood upholstered seat frame. | |
| ● | A Culture of Innovation. From inception, we have focused on developing unique, innovative and proprietary product platforms. We are continuously expanding and introducing new extensions to these platforms to broaden the appeal and grow the addressable market of our product offerings. We continually evaluate new products to complement our Sactionals and Sac lines and are currently developing accessories for the tech-savvy consumer. We have 17 issued U.S. utility patents and 21 issued foreign utility patents, 7 pending U.S. utility patent applications and 36 pending foreign utility patent applications. We expect to file U.S. and foreign patent applications for future innovations. We believe that our patent portfolio, combined with our innovative design approach may deter others from attempting to imitate or replicate our products. |
Strong Brand Loyalty
We believe our brand, products, and Designed for Life philosophy encourage people to share their stories and develop a personal relationship with Lovesac and its community. We foster these interactions through active direct engagement using several social media platforms. These are products that move, change and rearrange. They are soft, comfortable and fun to jump on. We believe that all of this causes our customers to uniquely serve as active ambassadors, providing organic public relations, word of mouth advertising, and customer testimonials and endorsements. In addition, our customers have a high repeat purchasing rate and high expected lifetime engagement.
| ● | High Repeat Purchasing Rates. We believe our focus on customer interaction and data driven analysis of their behavior and projected needs, drives our high customer repeat rates. Our repeat customers accounted for 38% of all transactions in fiscal 2019 and 39% in fiscal 2018. We believe that as we attract more customers to our product platforms, high repeat purchasing rates will allow us to capitalize on the high lifetime value of our customers. We expect new transactions to continue to become a larger portion of our transaction mix as we spend on customer acquisition. | |
| ● | Robust Customer Lifetime Value. Once customers invest in our products, they tend to stay with them, grow with them, and add to them. We believe our customers’ loyalty is an important driver of our CLV. An example of this is that our fiscal 2015 cohort has increased its CLV by 19.3% since year end fiscal 2015. We calculated our fiscal 2015 CLV by dividing the aggregate gross profits through fiscal 2019 attributable to the 2015 cohort (approximately $41,147,646) by the total number of customers in the 2015 cohort (38,423 customers). |
61
Omni-Channel Approach
Our distribution strategy allows us to reach customers through three distinct, brand-enhancing channels, which we refer to as our omni-channel approach.
| ● | Ecommerce. Through our mobile and ecommerce channel, we believe we are able to significantly enhance the consumer shopping experience, driving deeper brand engagement and loyalty, while also realizing margins that are more favorable than our showroom locations. We believe our robust technological capabilities position us well to benefit from the growing consumer preference to transact at home and via mobile devices. |
| ● | Showrooms. We carefully select the best small-footprint retail locations in high-end malls and lifestyle centers for our showrooms. The architecture and layout of these showrooms is designed to communicate our brand personality and key product features. Our goal is to educate first-time customers, creating an environment where people can touch, feel, read, and understand the technology behind our products. We are updating and remodeling many of our showrooms to reflect our new showroom concept, which emphasizes our unique product platform, and will be the standard for future showrooms. Our new showroom concept, introduced in 2016, utilizes technology in more experiential ways to increase traffic and sales. |
| ● | Shop in Shops. We are expanding the use of lower cost shop in shops to increase the number of locations where customers can experience and purchase our products. We have an ongoing working relationship with Costco to operate shop in shop programs, or “roadshows,” that usually run for 10 days at a time. These shop in shops are staffed similarly to our showrooms with associates trained to demonstrate and sell our products and promote our brand. We also believe our shop in shops provide a low cost alternative to drive brand awareness, in store sales, and ecommerce sales. |
Strong Millennial Appeal
We have targeted the millennial generation because we believe they desire branded products, coupled with transparent business practices, innovative solutions and the convenience of on-demand commerce. Additionally, members of the millennial generation, currently the most populous age group in the United States, are completing their educations, getting married, and starting or expanding their households. The peak ages for home furnishings purchases are 35-54. We believe that home furnishings will thrive as millennials and their children need larger residences and the necessary furnishings for household and family formation. The modularity of our Sactionals and ease of cleaning and replacing covers on Sactionals and Sacs provide our customers who are moving and expanding their households with the ability to evolve their purchases to accommodate the changes in their family and housing situations, offering us a competitive advantage.
Unique Distribution Capability
Due to the unique modularity of our Sactionals products and the shrinkability of our Sacs, we are able to distribute our products through nationwide express couriers and efficiently utilize warehouse space and international shipping routes. We believe our Sactionals are the only products in their category that enjoys this logistical advantage.
Seasoned and Committed Management Team
Shawn Nelson, our Chief Executive Officer and founder, has worked in almost every area of our Company and continues to focus on developing new products and intellectual property to drive future growth. Shawn has assembled a team of seasoned executives from diverse and relevant backgrounds, with decades of experience working with a wide range of leading global companies.
Jack Krause has served as our President and Chief Operating Officer since joining Lovesac in 2015. His experience with and deep understanding of complexities in managing high-growth brands are evident from his extensive history in consumer marketing and brand management. Since joining the Company, he has been instrumental in guiding the company from a retail-led business model to an omni-channel direct-marketing driven business model.
62
Donna Dellomo has served as our Executive Vice President and Chief Financial Officer since joining Lovesac in 2017. She is a Certified Public Accountant and has steered Lovesac toward new banking relationships that have the potential to supply the company with cheaper debt financing to support growth opportunities as needed.
David Jensen has served as our Chief Technology/Chief Information Officer since joining Lovesac in 2018 to lead our technology team as we evolve into a more marketing-driven digital-first retailer. Mr. Jensen served as the Senior Director of Information Services at the retailer J. Jill. At J. Jill, Mr. Jensen implemented Oracle retail ERP, re-engineered their direct to consumer fulfillment process, upgraded the point of sale system, managed multiple ecommerce sites and led their technology domain SOX and SEC compliance efforts.
Growth Strategies
In order to position Lovesac for future growth, in the last several years we made significant investments in overhead, optimized and integrated our business technologies and processes, and further developed our marketing tactics. In addition, we have refocused our strategy regarding our showrooms, moving to higher end malls, lifestyle centers, and street locations to support digital sales, our primary growth channel. Finally, we have committed to a new showroom design creating a much more interactive, technology driven experience that has resulted in higher traffic levels and conversion than previous showroom models.
These long-term initiatives have required a significant amount of management’s attention, which has shifted management’s focus away from short-term sales growth. As a result of these efforts, along with the implementation of the strategies noted below, we believe Lovesac is poised for meaningful sales growth. Our goal is to further improve our leadership in the home furnishings market by pursuing the following key strategies:
Continue to Build on Our Brand
Despite our loyal following, we believe there is a significant opportunity to increase our brand awareness. Based on our own internal study that was concluded in April 2017, we estimate that our brand awareness is less than 1% among all consumers nationally. Before 2017, we invested minimally in advertising. Since then, we have aggressively invested in brand building and direct marketing efforts, including direct mail, 30-second television commercials in select markets and social media. Our focus on building the Lovesac and Sactional brands has led to an increase in our new Sactional customer base, which grew by 55.8% in fiscal 2019. We plan to accelerate our ecommerce sales by building awareness via increased digital and social media, including digital videos and direct response television.
Update Showrooms and Add Other Locations
We intend to continue to renovate our current showroom locations, open new showrooms across the country in lifestyle centers, top tier shopping malls, and high street and urban locations, and expand product touch-feel points through the increased use of shop in shop locations. Because of their small size and above average productivity, we believe our approach to our showrooms creates a compelling opportunity to open more showrooms in a wide variety of retail spaces across North America.
| ● | Showrooms. In our showrooms, we focus on offering potential customers the opportunity to experience the considerable flexibility they have in selecting fabrics and configurations. We have evolved our model for new showrooms and are renovating our existing showrooms to reflect the standards of our new model. Our new showroom concept utilizes technology in more experiential ways to increase traffic and sales and communicate our brand personality and key product features. To attract customer traffic, our new model features two giant LED screens embedded in the walls that play videos demonstrating the Sactionals technology in motion. The entire architecture and layout of these new showrooms have been redesigned to communicate the brand personality and key product features, with the goal to educate first-time customers and create a self-service environment where people can touch, feel, read, and understand the technology behind our products. LED screens on the walls and iPads in the hands of the staff enhance what we believe is a “virtually merchandised” showroom in a very small footprint. In connection with these renovations, we have experienced increased sales and negotiated more favorable lease terms. |
63
| ● | Shop in Shops. We have an ongoing working relationship with Costco to operate shop in shop showrooms. We have been expanding the use of these shop in shop showrooms, and plan to seek other partners to operate similar concept showrooms, to increase the number of locations where customers can experience and purchase our products at a lower cost to us than our permanent showrooms. |
Increase Sales and Operating Margins
We seek to increase sales and operating margins through our premium pricing strategy and omni-channel platform, which we believe will require relatively small near term increases in fixed overhead.
| ● | Premium Pricing. Lovesac’s products are positioned in the premium couch segment of the furniture market. We market as premium products because of our foam fillings, higher quality materials and unique modularity requiring a distinct level of manufacturing capability. At our price point, we offer a unique value proposition that combines both beautiful aesthetics and utility to our customers that we believe our competitors cannot offer. Additionally, our high end branding strategy, further enhanced by our unsolicited celebrity endorsements and large social media following, commands premium pricing, as we feel lowering prices may negatively affect perception of our products. We believe that our pricing and higher upfront costs are also justified by our platform approach, where once a customer buys their first couch, the cost of expanding and adding to it over time is much less expensive than the traditional method of purchasing another new couch to replace the old one. Further, we believe that as we grow sales, we will be able to spread them over relatively fixed overhead and increase our margins. | |
| ● | Omni-Channel Platform. By leveraging our omni-channel platform, we cost-effectively drive traffic to our ecommerce channel, resulting in increased web-based sales and improved operating margins. We continually seek to improve our ecommerce capabilities to drive sales and take advantage of the lower cost of this channel. Our showrooms and other direct marketing efforts work in concert to drive customer conversion in ecommerce. In addition, our shop in shops provide a low cost alternative to drive brand awareness and both in-store and ecommerce sales. |
Supply Chain and Sourcing
Our products are manufactured in facilities located in Los Angeles, CA, Fort Worth, TX and Jackson County, NC, as well as in facilities located abroad in Shanghai, Hangzhou, Jiaxing and Foshan, China and in Ho Chi Minh City, Vietnam. We engage with local third parties for the manufacture of our products in each of those facilities. Lovesac does not own any of the manufacturing facilities where our products are assembled. We believe that our suppliers’ facilities are sufficient to meet our current needs. We believe that additional space will be available as needed to accommodate any needed expansion of our operations.
Seasonality
We experience seasonal fluctuations in our sales. A larger percentage of our sales occur in the fourth quarter of our fiscal year, which coincides with Cyber Monday (the first Monday after Thanksgiving, when online retailers typically offer holiday discounts), the holiday season and our related promotional and marketing campaigns. Our fiscal 2019 quarters in sequential order equaled 16.1%, 20.0%, 25.1% and 38.8% of total sales respectively.
Intellectual Property
We own 19 U.S. federal trademark registrations, 38 foreign trademark registrations, a number of U.S. and foreign trademark applications and common law trademark rights. Our registered U.S. trademarks include registrations for the Lovesac®, Lovesoft®, Sactionals®, Durafoam®, SAC® and Designed For Life® trademarks. Our trademarks, if not renewed, are scheduled to expire between 2020 and 2028.
64
In order to maintain our U.S. trademark registrations, we must continue to use the marks in commerce on the goods and services identified in the registrations and must make required filings with the U.S. Patent and Trademark Office at intervals specified by applicable statutes and regulations. Failure to comply with these requirements may result in abandonment or cancellation of the registrations.
We have 17 issued U.S. utility patents and 21 issued foreign utility patents, that are scheduled to expire between 2022 and 2037. We have 7 pending U.S. utility patent applications and 36 pending foreign utility patent applications. Our Sactional technology patents include our proprietary geometric modular system and segmented bi-coupling technology. We also have multiple patents pending and expect to file patent applications for future innovations.
Information Technology and Systems
We use information systems to support business intelligence and processes across our sales channels. We continue to invest in information systems and technology to enhance the customer experience, drive sales and create operating efficiencies. We utilize third-party providers for customer database and customer campaign management, ensuring efficient maintenance of information in a secure, backed-up environment. We also utilize a proprietary ecommerce platform hosted by a third-party provider and a well-developed proprietary data warehouse for business intelligence.
Specifically, we have adopted cloud computing solutions for our enterprise resource planning. We own, operate, and maintain elements of these systems with a sufficiently sized internal team of engineers and IT professionals, but significant portions of this system are operated by third parties that we do not control and which would require significant resources to replace internally.
We believe that our reliance on top tier cloud-based providers increases efficiency and reduces exposure to data breaches and other common digital threats. We expect this dependence on third parties to continue, in particular for NetSuite, which we use as our ERP system which provides functionality for our point-of-sale, financial reporting, order management and customer relationship management. We continue to innovate and optimize our technology systems as well as continue to make significant investments in our technology infrastructure to maintain and improve all aspects of our operations.
Properties
Our primary offices are located at Two Landmark Square, Suite 300, Stamford, CT 06901, where we occupy 15,730 square feet of office space pursuant to a lease agreement that expires in July 2024. We also lease retail space for our showrooms, in 75 locations throughout the majority of the U.S. states including Arizona, California, Colorado, Connecticut, Delaware, Florida, Georgia, Illinois, Indiana, Maine, Maryland, Massachusetts, Michigan, Minnesota, Missouri, Nevada, New Hampshire, New Jersey, New York, North Carolina, Ohio, Oregon, Pennsylvania, South Carolina, Tennessee, Texas, Utah, Virginia, Washington and Wisconsin.
Competition
Our business is rapidly evolving and intensely competitive. Our competition includes: furniture stores, big box retailers, department stores, specialty retailers and online furniture retailers and marketplaces, including the following:
| ● | Ashley Furniture, IKEA and other regional stores such as Bob’s Discount Furniture, Havertys, Raymour & Flanagan and Rooms To Go; | |
| ● | Costco, JCPenney and Macy’s; | |
| ● | Crate and Barrel, Ethan Allen, Pottery Barn and Restoration Hardware; and | |
| ● | Amazon, Wayfair, eBay, Joybird, Burrow, Campaign and One Kings Lane. |
65
We believe our combination of proprietary products, brand strength, loyal customer base, omni-channel approach, technological platform, unique consumer experience, logistical advantages and seasoned management team allow us to compete effectively against and differentiate ourselves from the competition.
Employees
As of May 8, 2019, we employed a total of 257 full time and 314 part time employees, and we contracted with 6 independent contractors. All employees and contractors are subject to contractual agreements that specify, among other things, requirements for confidentiality, ownership of newly developed intellectual property and restrictions on working for competitors as well as other matters.
Legal Proceedings
We are currently involved in, and may in the future be involved in, legal proceedings, claims, and investigations in the ordinary course of our business, including claims for infringing intellectual property rights related to our products. Although the results of these proceedings, claims, and investigations cannot be predicted with certainty, we do not believe that the final outcome of these matters is reasonably likely to have a material adverse effect on our business, financial condition, or results of operations. Regardless of final outcomes, however, any such proceedings, claims, and investigations may nonetheless impose a significant burden on management and employees and may come with costly defense costs or unfavorable preliminary and interim rulings.
Directors and Executive Officers
Each of our directors holds office until the next annual meeting of stockholders and until his or her successor is elected and qualified. Our officers remain in their respective position until termination or resignation.
The following table sets forth the name, age, and position of each of our directors and executive officers:
| Name | Age | Title | Date Appointed | |||
| Shawn Nelson | 42 | Chief Executive Officer and Director | February 27, 2017(1) | |||
| Jack Krause | 56 | President and Chief Operating Officer | February 27, 2017 | |||
| Donna Dellomo | 54 | Executive Vice President, Chief Financial Officer and Secretary | February 27, 2017 | |||
| Andrew Heyer | 61 | Chairman of the Board of Directors | February 27, 2017(2) | |||
| David Yarnell | 63 | Director | January 3, 2017(3) | |||
| William Phoenix | 62 | Director | January 3, 2017(4) | |||
| Jared Rubin | 39 | Director | January 3, 2017(5) | |||
| Christopher Bradley | 41 | Director | January 3, 2017(6) | |||
| John Grafer | 49 | Director | June 27, 2017 |
| (1) | Mr. Nelson has been a Director of SAC Acquisition LLC, the predecessor entity of the Company, since May 8, 2008. |
| (2) | Mr. Heyer has been a Director of SAC Acquisition LLC, the predecessor entity of the Company, since March 3, 2015. |
| (3) | Mr. Yarnell has been a Director of SAC Acquisition LLC, the predecessor entity of the Company, since May 8, 2008. |
| (4) | Mr. Phoenix has been a Director of SAC Acquisition LLC, the predecessor entity of the Company, since May 24, 2010. |
| (5) | Mr. Rubin has been a Director of SAC Acquisition LLC, the predecessor entity of the Company, since June 30, 2014. |
| (6) | Mr. Bradley has been a Director of SAC Acquisition LLC, the predecessor entity of the Company, since May 24, 2010. |
66
Business Experience
The following is a brief account of the education and business experience of each director and executive officer during at least the past five years, indicating each person’s business experience, principal occupation during the period, and the name and principal business of the organization by which they were employed.
Shawn Nelson founded Lovesac in 1998 and is currently serving as our Chief Executive Officer and as a member of the board of directors. Mr. Nelson is the lead designer of the Company’s patented products and directly oversees design, sourcing, public relations, investor relations and culture. In 2005, Mr. Nelson won Richard Branson’s “The Rebel Billionaire” on Fox and continues to participate in ongoing TV appearances. Mr. Nelson has a Master’s Degree in Strategic Design and Management and is a graduate-level instructor at Parsons, The New School for Design in New York City. Mr. Nelson is also fluent in Chinese with a BA in Mandarin from the University of Utah. We believe Mr. Nelson is qualified to serve on our board because of his leadership experience as our founder, his extensive knowledge of our Company and his service as our Chief Executive Officer.
Jack Krause has served as our President and Chief Operating Officer since 2015. From 2012 to 2015, Mr. Krause served as President of Vitamin World, a 425 store specialty chain. From 2011 to 2013, he served as Senior Vice President of Watch Station Global Retail and Skagen, where he led the growth of both businesses. From 2008 to 2010, Mr. Krause served as General Manager and in various executive positions at Sunglass Hut (Luxottica). From 2004 to 2006, Mr. Krause served in roles of increasing responsibility at Bath and Body Works, including Senior Vice-President of Brand Development. Prior to that, he spent 10 years in brand management at Jergens and Marion Consumer Products. Mr. Krause has a Bachelor of Science in Business Administration from Miami University.
Donna Dellomo is currently serving as our Executive Vice President and Chief Financial Officer, Treasurer and Secretary. From January 1998 to January 2017, Ms. Dellomo served as Vice-President and Chief Financial Officer of Perfumania Holdings, a publicly traded company with over 290 retail locations, owned and licensed brands and a wholesale distribution network. Between October 1988 and December 1997, Ms. Dellomo served as Internal Audit Manager, Accounting Manager and Corporate Controller at Cybex International, Inc., a publicly traded company that manufactured and distributed fitness, rehabilitative and health care equipment. Ms. Dellomo is a Certified Public Accountant with focus on audit and tax and is also a member of the Board of Trustees of Molloy College and Chairperson of Molloy’s Fiscal Affairs and Audit Committee.
Andrew R. Heyer is the Chairman of our board of directors. Mr. Heyer is a finance professional with over 35 years of experience investing the consumer and consumer-related products and services industries. He has deployed in excess of $1 billion of capital over that time frame, and has guided several public and private companies as a member of their boards of directors. Mr. Heyer is the Chief Executive Officer and Founder of Mistral Equity Partners, a private equity fund manager founded in 2007 that invests in the consumer industry. Prior to founding Mistral, Mr. Heyer served as a Founding Managing Partner of Trimaran Capital Partners. Until 1995, Mr. Heyer was a vice chairman of CIBC World Markets Corp. and a co-head of the CIBC Argosy Merchant Banking Funds. Prior to joining CIBC World Markets Corp., Mr. Heyer was a founder and Managing Director of The Argosy Group L.P. Prior to joining Argosy, Mr. Heyer was a Managing Director at Drexel Burnham Lambert Incorporated and, prior to that, he worked at Shearson/American Express. From 1993 to 2009 and from 2012 to April 2019, he has served on the board of The Hain Celestial Group (Nasdaq: HAIN), a natural and organic food and products company. Since December 2016, Mr. Heyer has served as a director of XpresSpa Group, Inc. (Nasdaq: XSPA), a diversified holding company. From April 2017 to March 2019, Mr. Heyer served as a director and president of Haymaker Acquisition Corp., which was acquired by OneSpaWorld Holdings Limited (Nasdaq: OSW) on March 19, 2019. Since March 2019, Mr. Heyer has served on the board of directors of OneSpaWorld Holdings Limited. Mr. Heyer also serves on the boards of directors of several private companies, including Worldwise, a pet accessories business. Mr. Heyer received his B.Sc. and M.B.A. from the Wharton School of the University of Pennsylvania, graduating magna cum laude. We believe Mr. Heyer is qualified to serve on our board because of his extensive experience in private equity investing in the consumer goods industry and his experience on other private and public company boards.
67
Christopher Bradley is a member of our board of directors. He is a Managing Director at Mistral Equity Partners, which he joined in 2008. Mr. Bradley has over 10 years of experience in identifying acquisition candidates, due diligence experience, including accounting and financial modeling acumen, and a background in deal structuring. Since 2016, he has served as a member of the boards of directors of Creminelli Fine Meats, LLC, a privately held premium priced charcuterie wholesaler, and The Beacon Consumer Incubator Fund, a venture capital fund that invests in consumer technology companies. He has also guided Mistral portfolio companies in an operational role and served on the board of directors of Jamba, Inc. (Nasdaq: JMBA) from 2009 to 2013 and as the chief financial officer of Haymaker Acquisition Corp. from April 2017 to March 2019. Prior to joining Mistral, Mr. Bradley served as an investment banker at Banc of America Securities, a Manager in Burger King’s strategy group, and a Manager at PricewaterhouseCoopers management consulting practice. He earned an A.B. from the University of Chicago and an M.B.A. from The Harvard Business School. We believe Mr. Bradley is qualified to serve on our board because of his experience in private equity investing and investment banking, his accounting and financial modeling expertise and his experience on other public company boards.
David Yarnell is a member of our board of directors. He is a Managing General Partner at BEV Capital, a consumer-focused venture fund in Stamford, Connecticut which he co-founded in 1997. He has served as a board member at SAC Acquisition LLC since BEV Capital’s initial investment in 2005. Mr. Yarnell has over 30 years of experience in the consumer sector helping companies build strategies to grow revenues through brand development, advertising and channel management. He has also helped young companies build needed organizational skills, structures and systems as a foundation for successful growth. Mr. Yarnell has served on numerous boards of directors of public and private companies including Buca di Beppo Restaurants, Travel Holdings and Alloy Media. In addition to his role at BEV Capital, Mr. Yarnell is the Chief Executive Officer of CertaScan, a growing healthcare security IT company. From 2009 to 2013, Mr. Yarnell served as the Chief Executive Officer of Mom365, the nation’s largest in-hospital newborn photography company, and from 2008 to 2015, Mr. Yarnell served as an Operating Partner at Falconhead Capital, a middle market consumer-focused private equity firm. Prior to holding these positions, Mr. Yarnell was a Partner at Consumer Venture Partners, the Chief Executive Officer of MEXX, a fashion apparel firm, and, from 1984 to 1991, a consultant at McKinsey in its Consumer Practice and Post Merger Management Groups for clients worldwide. From 1982 to 1984, Mr. Yarnell was in product management at General Mills, and from 1977 to 1982, Mr. Yarnell was a buyer at Abraham & Straus. He has an M.B.A. from Harvard Business School and a B.S. in Mathematics from Tufts University. We believe Mr. Yarnell is qualified to serve on our board because of his experience in venture capital investing in consumer companies, his experience with brand development, advertising and channel management in the consumer industry and his experience on other public and private company boards.
Jared Rubin is a member of our board of directors. He is currently a director at Schottenstein Stores Corporation. Since 2013, Mr. Rubin has held executive and board of director positions within the Schottenstein family of companies with a focus in the retail sector, including strategy and financial based roles at American Signature, Inc. and Artisan de Luxe. From 2009 to 2013, Mr. Rubin was a Vice President at Tiger Infrastructure Partners, a private equity investment firm. Mr. Rubin previously served at Lehman Brothers as a member of its private equity investment team within the firm’s asset management division and as an investment banker, holding various capital markets, investment banking and proprietary investment roles within the firm. He holds a B.Sc. in Economics from the Wharton School of the University of Pennsylvania. We believe Mr. Rubin is qualified to serve on our board because of his extensive background in the retail, his experience in private equity investment and investment banking and leadership experience as a senior executive and director of retail and consumer product companies.
William P. Phoenix is a member of our board of directors. Since 2007, Mr. Phoenix has been a Managing Director at Mistral Equity Partners. He has extensive experience as a provider of all forms of capital to non-investment grade companies. From 2002 to 2007, Mr. Phoenix was a Managing Director of Trimaran Capital Partners, L.L.C.. Mr. Phoenix spent a good portion of his career in various capacities at the Canadian Imperial Bank of Commerce (CIBC), beginning in 1982. He was a Managing Director of CIBC Capital Partners, where he focused on mezzanine transactions and private equity opportunities. While at CIBC, he also had management responsibilities for Acquisition Finance, Mezzanine Finance, and the Loan Workout and Restructuring businesses. Mr. Phoenix has been a member of the board of directors of Lovesac since 2010 and Blueport Commerce. Mr. Phoenix received his B.A. in Economics from the University of Western Ontario and his M.B.A. from the University of Toronto. He is a graduate of the Leadership New York Program. We believe Mr. Phoenix is qualified to serve on our board because of his extensive background in finance and private equity investment and his experience on other private company boards.
68
John Grafer is a member of our Board of Directors. Since 2009, Mr. Grafer has been a principal at Satori Capital, LLC, a multi-strategy alternative investment firm founded on the principles of conscious capitalism. Mr. Grafer is a member of Satori’s investment committee, a board member of Longhorn Health Solutions, SunTree Snack Foods and Zorch International, a board observer for Aspen Heights, and a former board member of California Products Corporation and FWT. Prior to joining Satori in 2009, Mr. Grafer was senior vice president at Giuliani Partners, a principal investment and consulting firm founded by former New York City Mayor Rudolph W. Giuliani. Prior to joining Giuliani Partners in 2003, Mr. Grafer was a member of the mergers and acquisitions group at Credit Suisse First Boston, a member of the proprietary trading group at J.P. Morgan Chase, and a team member at Ernst & Young, where he earned his C.P.A. Mr. Grafer has also assisted a family office with early stage investments in sustainably managed companies, including Honest Tea. Mr. Grafer is an elected member of the board of directors and executive committee of Americans For Fair Taxation® (FairTax®) and has been a first-round judge for the McCloskey Business Plan competition at the University of Notre Dame. Mr. Grafer received a B.B.A. from the University of Notre Dame and an M.B.A. in finance from the University of Chicago Booth School of Business. We believe Mr. Grafer is qualified to serve on our board because of his substantial experience in private equity investing and investment banking, his accounting expertise and his experience on other company boards.
Family Relationships
There are no family relationships among our directors or officers.
Board Composition
Our board of directors currently consists of seven (7) members and is authorized to have no less than five (5) members nor more than seven (7) members. Each director of the Company serves until the next annual meeting of stockholders and until his successor is elected and duly qualified, or until his earlier death, resignation or removal.
We have no formal policy regarding board diversity. In selecting board candidates, we seek individuals who will further the interests of our stockholders through an established record of professional accomplishment, the ability to contribute positively to our collaborative culture, knowledge of our business and understanding of our prospective markets. We plan to recruit additional independent directors who can bring specific expertise and experience that is relevant to the Company’s business and future direction.
Director Independence
Our board of directors has undertaken a review of the independence of each director. Based on information provided by each director concerning his background, employment and affiliations, our board of directors has determined that our directors (other than Andrew Heyer, Shawn Nelson and John Grafer) do not have relationships that would interfere with the exercise of independent judgment in carrying out the responsibilities of a director and that each of our directors (other than Andrew Heyer, Shawn Nelson and John Grafer) is “independent” as that term is defined under the listing standards of Nasdaq. In making these determinations, our board of directors considered the current and prior relationships that each non-employee director has with our company and all other facts and circumstances our board of directors deemed relevant in determining their independence and eligibility to serve on the committees of our board of directors, including the transactions involving them described in the section titled “Certain Relationships and Related Party Transactions.”
Board Committees
Our board of directors has established an audit committee and a compensation committee. Audit committees generally must be comprised of at least three independent directors. Compensation committees generally must be comprised of at least two independent directors. As a result of our loss of “controlled company” status in connection with this offering, the Company is allowed to phase-in its compliance with the compensation committee composition requirements as follows: (1) one member must satisfy the requirement at the closing of this offering; (2) a majority of members must satisfy the requirement within 90 days of the closing of this offering; and (3) all members must satisfy the requirement within one year of the closing of this offering. Furthermore, the Company has twelve months from the closing of this offering to comply with the majority independent board requirement. Our board of directors may establish other committees to facilitate the management of our business. The functions of the audit and compensation committees are described below. Directors serve on these committees until their resignation or until otherwise determined by our board of directors.
69
Audit Committee
Our audit committee consists of William Phoenix, as the chair, and Messrs. Rubin and Yarnell. Our board of directors has determined that Messrs. Phoenix, Rubin and Yarnell qualify as “audit committee financial experts” within the meaning of Item 407(d) of Regulation S-K promulgated under the Securities Act. Our audit committee assists our board of directors in its oversight of our accounting and financial reporting process and the audits of our financial statements. Our audit committee, which operates under a written charter that is posted on the Investor Relations section of our website at www.lovesac.com, is, among other things, responsible for:
| ● | appointing, approving the compensation of, and assessing the independence of our registered public accounting firm; | |
| ● | overseeing the work of our registered public accounting firm, including through the receipt and consideration of reports from such firm; | |
| ● | reviewing and discussing with management and the registered public accounting firm our annual and quarterly financial statements and related disclosures; | |
| ● | monitoring our internal control over financial reporting, disclosure controls and procedures and code of business conduct and ethics; | |
| ● | overseeing our internal accounting function; | |
| ● | discussing our risk management policies; | |
| ● | establishing policies regarding hiring employees from our registered public accounting firm and procedures for the receipt and retention of accounting-related complaints and concerns; | |
| ● | meeting independently with our internal accounting staff, registered public accounting firm and management; | |
| ● | reviewing and approving or ratifying related party transactions; and | |
| ● | preparing the audit committee reports required by SEC rules. |
Compensation Committee
Our compensation committee consists of Mr. Heyer, as the chair, and Mr. Grafer. Our compensation committee, which operates under a written charter that is posted on the Investor Relations section of our website at www.lovesac.com, is, among other things, responsible for:
| ● | reviewing and approving corporate goals and objectives with respect to Chief Executive Officer compensation; | |
| ● | making recommendations to our board with respect to the compensation of our Chief Executive Officer and our other executive officers; | |
| ● | overseeing evaluations of our senior executives; | |
| ● | reviewing and assessing the independence of compensation advisers; | |
| ● | overseeing and administering our equity incentive plans; | |
| ● | reviewing and making recommendations to our board with respect to director compensation; and | |
| ● | preparing the compensation committee reports required by SEC rules. |
70
Compensation Committee Interlocks and Insider Participation
No member of our compensation committee will be or at any time during the past year have been one of our officers or employees. None of our executive officers currently serves or in the past year has served as a member of the board of directors or compensation committee of any entity that has one or more executive officers serving on our board of directors or compensation committee.
Director Nominations
The board of directors as a whole will consider director candidates recommended for nomination by our stockholders during such times as they are seeking proposed nominees to stand for election at the next annual meeting of stockholders (or, if applicable, a special meeting of stockholders). Our stockholders that wish to nominate a director for election to our board of directors should follow the procedures set forth in our bylaws.
We have not formally established any specific, minimum qualifications that must be met or skills that are necessary for directors to possess. In general, in identifying and evaluating nominees for director, our board of directors considers educational background, diversity of professional experience, knowledge of our business, integrity, professional reputation, independence, wisdom, and the ability to represent the best interests of our stockholders.
Board Leadership Structure and Risk Oversight
The board of directors oversees our business and considers the risks associated with our business strategy and decisions.
The board currently implements its risk oversight function as a whole. Each of the board committees will provide risk oversight in respect of its areas of concentration and reports material risks to the board of directors for further consideration.
Code of Business Conduct and Ethics
We have adopted a Code of Business Conduct and Ethics (the “Code of Ethics”), that applies to all directors, officers and employees of our Company and its subsidiaries. This Code of Ethics covers a wide range of business practices and procedures and promotes honest and ethical conduct, full, fair, accurate and timely disclosure in all reports and documents that our Company files under public communication, compliance with all applicable governmental laws, rules and regulations, protection of company assets, and fair dealing practices. The full text of our Code of Ethics is posted on the Investor Relations section of our website at www.lovesac.com.. We will disclose future amendments or waivers to our code of business conduct and ethics on our website within four business days following the date of the amendment or waiver.
71
As an emerging growth company under the JOBS Act we have opted to comply with the executive compensation disclosure rules applicable to “smaller reporting companies,” which require compensation disclosure for our principal executive officer and the two most highly compensated executive officers (other than our principal executive officer) serving as executive officers at the end of the fiscal year. This section describes the executive compensation program in place for our Named Executive Officers for fiscal 2017 and fiscal 2018, who are the individuals who served as our principal executive officer and two most highly compensated executive officers.
The following table summarizes the compensation of our Named Executive Officers paid by us during the fiscal years ended February 3, 2019 and February 4, 2018. No other executive officers or directors received annual compensation in excess of $100,000 during the last two fiscal years. This table does not include any equity grants made by SAC Acquisition LLC, which are discussed under the heading “Outstanding Equity Awards at Fiscal Year-End.”
Summary Compensation Table
| Name and Principal Position |
Fiscal Year |
Salary ($) |
Bonus ($) |
Stock Awards ($)(1) |
Option Awards ($) |
Non-Equity Incentive Plan Compensation ($) | Nonqualified Deferred Compensation Earnings ($) |
All Other Compensation ($)(2) | Total ($) |
|||||||||||||||||||||||||||
| Shawn Nelson | 2019 | 350,000 | 475,000 | 1,764,442 | - | - | - | 12,285 | 2,601,727 | |||||||||||||||||||||||||||
| Chief Executive Officer | 2018 | 331,971 | 175,000 | 1,136,525 | (3) | - | - | - | - | 1,643,596 | ||||||||||||||||||||||||||
| Jack A. Krause | 2019 | 350,000 | 225,000 | 700,185 | - | - | - | 17,077 | 1,292,262 | |||||||||||||||||||||||||||
| President and Chief Operating Officer | 2018 | 332,763 | 175,000 | 1,136,625 | (3) | - | - | - | - | 1,644.388 | ||||||||||||||||||||||||||
| Donna L. Dellomo | 2019 | 325,000 | 230,000 | 336,083 | - | - | - | 16,700 | 907,783 | |||||||||||||||||||||||||||
| Executive Vice President and Chief Financial Officer | 2018 | 325,552 | 130,000 | 519,600 | (3) | - | - | - | - | 975,152 | ||||||||||||||||||||||||||
| (1) | Amounts shown in this column do not reflect dollar amounts actually received by our Named Executive Officers. Instead, these amounts reflect the aggregate grant date fair value of each restricted stock unit granted computed in accordance with the provisions of FASB ASC Topic 718. Assumptions used in the calculation of these amounts are included in Note 7 to our consolidated financial statements included in this prospectus. |
| (2) | Amounts shown represent 401(k) matching payments. |
| (3) | Amounts previously disclosed of $284,156 for Messrs. Nelson and Krause and $129,900 for Ms. Dellomo represented amounts vested as of the end of fiscal 2018. The amounts shown now reflect, the aggregate grant date fair value including the unvested portion of each restricted stock unit granted in fiscal 2018. |
Bonuses
Pursuant to the employment agreements of Messrs. Nelson and Krause and Ms. Dellomo, each named executive officer is eligible to receive an annual bonus based on the achievement of a combination of company-wide and individual performance goals set by our board of directors.
Fiscal 2019 Bonuses
Messrs. Nelson and Krause each received an annual bonus equal to 50% of their respective annual base salaries and Ms. Dellomo received an annual bonus equal to 40% of her annual base salary pursuant to the terms of their employment agreements as the Company achieved an internal adjusted EBITDA amount of $3.4 million against an internal adjusted EBITDA target of $3.2 million that was set by our board of directors.
In connection with the completion of our IPO, Messrs. Nelson and Krause and Ms. Dellomo received cash bonuses of $300,000, $50,000 and $100,000, respectively.
72
Fiscal 2018 Bonuses
Messrs. Nelson and Krause each received an annual bonus equal to 50% of their respective annual base salaries and Ms. Dellomo received an annual bonus equal to 40% of her annual base salary pursuant to the terms of their employment agreements as the Company achieved an internal adjusted EBITDA amount of $3.3 million against an internal adjusted EBITDA target of $3.5 million that was set by our board of directors.
Employment Arrangements
We have agreements with certain of our Named Executive Officers, which include provisions regarding post-termination compensation. We do not have a formal severance policy or plan applicable to our executive officers as a group. The following summaries of the employment agreements are qualified in their entirety by reference to the text of the employment agreements, as amended, which were filed as exhibits to the registration statement of which this prospectus is a part.
Shawn Nelson Employment Agreement
On October 26, 2017, Mr. Nelson entered into an amended and restated employment agreement to be the Chief Executive Officer of the Company. The employment agreement has a term commencing on the date thereof and continuing until terminated (i) upon death of the employee, (ii) upon disability, (iii) for cause, (iv) with good reason or without cause, or (v) voluntarily. The employment agreement provides for an annual base salary of $350,000 per year, subject to annual review. Mr. Nelson is eligible to receive an annual bonus provided that he achieves performance targets determined by the board of directors. If the Company achieves 90% of its annual EBITDA target for the applicable completed fiscal year the annual bonus shall be 45% of his base salary. In the event that the Company achieves 110% of its annual EBITDA target for the applicable completed fiscal year the annual bonus shall be 60% of his base salary. Furthermore, if the Company achieves 120% of its annual EBITDA target for the applicable completed fiscal year the annual bonus shall be 75% of his base salary.
Pursuant to the employment agreement Mr. Nelson was awarded 105,000 restricted stock units (“RSUs”) the terms of which are governed by the Company’s 2017 Equity Incentive Plan and the applicable grant agreement. Half of such RSUs are subject to time-based vesting and half are subject to performance vesting.
Additionally, the agreement indicates that (i) in the event the Company consummates an IPO on or prior to March 31, 2019, (ii) Mr. Nelson remains employed with the Company, and (iii) Jack Krause purchases IPO shares as provided in his employment agreement, then the Company shall make an additional grant of RSUs in an amount which is the lesser of (a) the number of IPO shares purchased by Mr. Krause or (b) the number of RSUs remaining available for grant under the Company’s 2017 Equity Incentive Plan. The employment agreement also contains, among other things, the following material provisions: (i) reimbursement for all reasonable travel and other out-of-pocket expenses incurred in connection with his employment; (ii) paid vacation leave; (iii) health benefits; and (iv) a severance payment equal to eighteen (18) months of base salary upon termination by Mr. Nelson for Good Reason or by the Company without Cause (as defined in the agreement), with restrictive covenants applicable for a corresponding period after termination.
Jack Krause Employment Agreement
On October 26, 2017, Mr. Krause entered into an amended and restated employment agreement to be President and Chief Operating Officer of the Company. The employment agreement has a term commencing on the date thereof and continuing until terminated (i) upon death of the employee, (ii) upon disability, (iii) for cause, (iv) with good reason or without cause, or (v) voluntarily. The employment agreement provides for an annual base salary of $350,000 per year, subject to annual review. Mr. Krause is eligible to receive an annual bonus provided that he achieves performance targets determined by the board of directors. If the Company achieves 90% of its annual EBITDA target for the applicable completed fiscal year the annual bonus shall be 45% of his base salary. In the event that the Company achieves 110% of its annual EBITDA target for the applicable completed fiscal year the annual bonus shall be 60% of his base salary. Furthermore, if the Company achieves 120% of its annual EBITDA target for the applicable completed fiscal year the annual bonus shall be 75% of his base salary.
73
Pursuant to the employment agreement, Mr. Krause was awarded 105,000 RSUs the terms of which are governed by the Company’s 2017 Equity Incentive Plan and the applicable grant agreement. Half of such RSUs are subject to time-based vesting and half are subject to performance vesting.
Additionally, the agreement indicates that (i) in the event the Company consummates an IPO on or prior to March 31, 2019, and (ii) Mr. Krause remains employed with the Company, then the Company shall use commercially reasonable efforts to cause the underwriter(s) in such IPO to allocate a number of IPO shares equal to (a) $50,000 divided by the public offering price per share in our IPO or (b) such lesser number of IPO shares as Mr. Krause may elect upon reasonable prior notice to the Company. Mr. Krause also received a signing bonus payable on the first regular payroll date that was 5 days following the date of the employment agreement, in the amount of $50,000. The employment agreement also contains, among other things, the following material provisions: (i) reimbursement for all reasonable travel and other out-of-pocket expenses incurred in connection with his employment; (ii) paid vacation leave; (iii) health benefits; and (iv) a severance payment equal to twelve (12) months of base salary upon termination by Mr. Krause for Good Reason or by the Company without Cause (as defined in the agreement), with restrictive covenants applicable for a corresponding period after termination.
Donna L. Dellomo Employment Agreement
On October 26, 2017, Ms. Dellomo entered into an amended and restated employment agreement to be Executive Vice President and Chief Financial Officer of the Company. The employment agreement has a term commencing on the date thereof and continuing until terminated (i) upon death of the employee, (ii) upon disability, (iii) for cause, (iv) with good reason or without cause, or (v) voluntarily. The employment agreement provides for an annual base salary of $325,000 per year, subject to annual review. Ms. Dellomo is eligible to receive an annual bonus provided that she achieves performance targets determined by the board of directors. If the Company achieves 90% of its annual EBITDA target for the applicable completed fiscal year the annual bonus shall be 35% of her base salary. In the event that the Company achieves 110% of its annual EBITDA target for the applicable completed fiscal year the annual bonus shall be 45% of her base salary. Furthermore, if the Company achieves 120% of its annual EBITDA target for the applicable completed fiscal year the annual bonus shall be 55% of her base salary.
Pursuant to the employment agreement, Ms. Dellomo was awarded 48,000 RSUs the terms of which are governed by the Company’s 2017 Equity Incentive Plan and the applicable grant agreement. Half of such RSUs are subject to time-based vesting and half are subject to performance vesting.
The agreement also contains, among other things, the following material provisions: (i) reimbursement for all reasonable travel and other out-of-pocket expenses incurred in connection with her employment; (ii) paid vacation leave; (iii) health benefits; and (iv) a severance payment equal to twelve (12) months of base salary upon termination by Ms. Dellomo for Good Reason or by the Company without Cause (as defined in the agreement), with restrictive covenants applicable for a corresponding period after termination.
2017 Equity Incentive Plan
Our 2017 Equity Incentive Plan (the “Equity Plan”), was approved by our board of directors and our stockholders on August 26, 2017. It is intended to make available incentives that will assist us to attract, retain and motivate employees, including officers, consultants and directors. We may provide these incentives through the grant of stock options, stock appreciation rights, restricted stock, restricted stock units, performance shares and units and other cash-based or stock-based awards.
In 2018, the Equity Plan was amended to increase the shares of our common stock authorized and reserved for issuance under the Equity Plan to 615,066. As of February 3, 2019, there are 160,177 shares of our common stock remaining for issuance under the Equity Plan.
Appropriate adjustments will be made in the number of authorized shares and other numerical limits in the Equity Plan and in outstanding awards to prevent dilution or enlargement of participants’ rights in the event of a stock split or other change in our capital structure. Shares subject to awards which expire or are cancelled or forfeited will again become available for issuance under the Equity Plan. The shares available will not be reduced by awards settled in cash or by shares withheld to satisfy tax withholding obligations. Only the net number of shares issued upon the exercise of stock appreciation rights or options exercised by means of a net exercise or by tender of previously owned shares will be deducted from the shares available under the Equity Plan.
74
The Equity Plan will be generally administered by the compensation committee of our board of directors. Subject to the provisions of the Equity Plan, the compensation committee will determine in its discretion the persons to whom and the times at which awards are granted, the sizes of such awards and all of their terms and conditions. However, the compensation committee may delegate to one or more of our officers the authority to grant awards to persons who are not officers or directors, subject to certain limitations contained in the Equity Plan and award guidelines established by the committee. The compensation committee will have the authority to construe and interpret the terms of the Equity Plan and awards granted under it. The Equity Plan provides, subject to certain limitations, for indemnification by us of any director, officer or employee against all reasonable expenses, including attorneys’ fees, incurred in connection with any legal action arising from such person’s action or failure to act in administering the Equity Plan.
The Equity Plan will authorize the compensation committee, without further stockholder approval, to provide for the cancellation of stock options or stock appreciation rights with exercise prices in excess of the fair market value of the underlying shares of common stock in exchange for new options or other equity awards with exercise prices equal to the fair market value of the underlying common stock or a cash payment.
Awards may be granted under the Equity Plan to our employees, including officers, directors or consultants or those of any present or future parent or subsidiary corporation or other affiliated entity. All awards will be evidenced by a written agreement between us and the holder of the award and may include any of the following:
| ● | Stock options. We may grant nonstatutory stock options or incentive stock options (as described in Section 422 of the Internal Revenue Code), each of which gives its holder the right, during a specified term (not exceeding 10 years) and subject to any specified vesting or other conditions, to purchase a number of shares of our common stock at an exercise price per share determined by the administrator, which may not be less than the fair market value of a share of our common stock on the date of grant. | |
| ● | Stock appreciation rights. A stock appreciation right gives its holder the right, during a specified term (not exceeding 10 years) and subject to any specified vesting or other conditions, to receive the appreciation in the fair market value of our common stock between the date of grant of the award and the date of its exercise. We may pay the appreciation in shares of our common stock or in cash. | |
| ● | Restricted stock. The administrator may grant restricted stock awards either as a bonus or as a purchase right at such price as the administrator determines. Shares of restricted stock remain subject to forfeiture until vested, based on such terms and conditions as the administrator specifies. Holders of restricted stock will have the right to vote the shares and to receive any dividends paid, except that the dividends may be subject to the same vesting conditions as the related shares. |
| ● | Restricted stock units. Restricted stock units represent rights to receive shares of our common stock (or their value in cash) at a future date without payment of a purchase price, subject to vesting or other conditions specified by the administrator. Holders of restricted stock units have no voting rights or rights to receive cash dividends unless and until shares of common stock are issued in settlement of such awards. However, the administrator may grant restricted stock units that entitle their holders to dividend equivalent rights. | |
| ● | Performance shares and performance units. Performance shares and performance units are awards that will result in a payment to their holder only if specified performance goals are achieved during a specified performance period. Performance share awards are rights whose value is based on the fair market value of shares of our common stock, while performance unit awards are rights denominated in dollars. The administrator establishes the applicable performance goals based on one or more measures of business performance enumerated in the Equity Plan, such as revenue, earnings, gross margin, net income or total stockholder return. To the extent earned, performance share and unit awards may be settled in cash or in shares of our common stock. Holders of performance shares or performance units have no voting rights or rights to receive cash dividends unless and until shares of common stock are issued in settlement of such awards. However, the administrator may grant performance shares that entitle their holders to dividend equivalent rights. |
75
| ● | Cash-based awards and other stock-based awards. The administrator may grant cash-based awards that specify a monetary payment or range of payments or other stock-based awards that specify a number or range of shares or units that, in either case, are subject to vesting or other conditions specified by the administrator. Settlement of these awards may be in cash or shares of our common stock, as determined by the administrator. Their holder will have no voting rights or right to receive cash dividends unless and until shares of our common stock are issued pursuant to the award. The administrator may grant dividend equivalent rights with respect to other stock-based awards. |
In the event of a change in control as described in the Equity Plan, the acquiring or successor entity may assume or continue all or any awards outstanding under the Equity Plan or substitute substantially equivalent awards. Any awards which are not assumed or continued in connection with a change in control or are not exercised or settled prior to the change in control will terminate effective as of the time of the change in control. The compensation committee may provide for the acceleration of vesting of any or all outstanding awards upon such terms and to such extent as it determines, except that the vesting of all awards held by members of the board of directors who are not employees will automatically be accelerated in full. The Equity Plan also authorizes the compensation committee, in its discretion and without the consent of any participant, to cancel each or any outstanding award denominated in shares upon a change in control in exchange for a payment to the participant with respect to each share subject to the cancelled award of an amount equal to the excess of the consideration to be paid per share of common stock in the change in control transaction over the exercise price per share, if any, under the award.
The Equity Plan will continue in effect until it is terminated by the administrator, provided, however, that all awards will be granted, if at all, within 10 years of its effective date. The administrator may amend, suspend or terminate the Equity Plan at any time, provided that without stockholder approval, the plan cannot be amended to increase the number of shares authorized, change the class of persons eligible to receive incentive stock options, or effect any other change that would require stockholder approval under any applicable law or listing rule.
Outstanding Equity Awards at Fiscal Year-End
SAC Acquisition LLC is our principal shareholder and owned 5,244,094 shares of common stock of the Company as of February 3, 2019. SAC Acquisition LLC had 2,279,677 units outstanding as of February 3, 2019. Certain employees of the Company and its affiliates previously received unit option awards pursuant to the SAC Acquisition LLC 2007 Unit Plan (the “2007 Unit Plan”) and the SAC Acquisition LLC 2010 Unit Plan (the “2010 Unit Plan”). The options are exercisable into common units of SAC Acquisition LLC. The Company did not adopt or assume the 2010 Unit Plan or the 2007 Unit Plan in the reorganization, therefore upon exercise of the outstanding options the holders will receive common units of SAC Acquisition LLC.
The following table sets forth for each Named Executive Officer certain information concerning the outstanding SAC Acquisition LLC equity awards as of February 3, 2019.
| Unit Option Awards | ||||||||||||||||||||
| Name | Grant Date | Number of securities underlying unexercised options exercisable (1) (#) | Number of securities underlying unexercised options unexercisable (#) | Equity incentive plan awards: Number of securities underlying unexercised unearned options (#) | Option exercise price ($) | Option expiration date | ||||||||||||||
| Shawn Nelson | 05/24/2010 | 13,503 | — | — | 23.00 | 05/24/2020 | ||||||||||||||
| 05/24/2010 | — | — | 9,000 | 63.08 | 05/24/2020 | |||||||||||||||
| 05/24/2010 | — | — | 3,000 | 76.88 | 05/24/2020 | |||||||||||||||
| 06/01/2012 | 8,185 | — | — | 26.00 | 06/01/2022 | |||||||||||||||
| 06/01/2012 | — | — | 999 | 63.08 | 06/01/2022 | |||||||||||||||
| 06/01/2012 | — | — | 427 | 76.88 | 06/01/2022 | |||||||||||||||
| 12/10/2014 | 4,475 | — | — | 36.11 | 12/10/2024 | |||||||||||||||
| 12/10/2014 | — | — | 8,951 | 36.11 | 12/10/2024 | |||||||||||||||
| 10/26/2017 | 76,198 | — | — | 12.75 | 10/26/2027 | |||||||||||||||
| Jack Krause | 07/27/2016 | — | — | 6,363 | 36.11 | 07/27/2026 | ||||||||||||||
| 07/27/2016 | 15,908 | — | — | 36.11 | 07/27/2026 | |||||||||||||||
| Donna L. Dellomo | 01/30/2017 | 15,908 | — | 3,182 | 36.11 | 01/30/2027 | ||||||||||||||
| (1) | Upon exercise of the options, holders will be entitled to purchase common units of SAC Acquisition LLC. |
76
The following table sets forth for each Named Executive Officer certain information concerning the outstanding equity awards as of February 3, 2019.
| Stock Awards | ||||||||||||||||
| Name | Number of shares or units of stock that have not vested (#) | Market value of shares of units of stock that have not vested ($) | Equity incentive plan awards: Number of unearned shares, units or other rights that have not vested (#) | Equity incentive plan awards: Market or payout value of unearned shares, units or other rights that have not vested ($) | ||||||||||||
| Shawn Nelson | - | - | 140,010 | 3,323,837 | ||||||||||||
| Jack Krause | - | - | 95,145 | 2,258,742 | ||||||||||||
| Donna L. Dellomo | - | - | 44,170 | 1,048,596 | ||||||||||||
Retirement or Similar Benefit Plans
401(k) Plan
Our 401(k) Plan (the “TLC 401(k) Plan”), is designed to provide retirement benefits to all eligible full-time and part-time employees. The TLC 401(k) Plan provides employees with the opportunity to save for retirement on a tax-favored basis. The TLC 401(k) Plan calls for elective deferral contributions, safe harbor matching 100% contributions, not to exceed 4% of their compensation with immediate vesting, and profit sharing contributions. All our employees (both full-time and part-time) (except for union employees and nonresident aliens) are eligible to participate in the TLC 401(k) Plan as of the day of the month they complete one (1) month of service and are over the age of 21.
Resignation, Retirement, Other Termination, or Change in Control Agreements
For a description of the material terms of each contract, agreement, plan or arrangement, whether written or unwritten, that provides for payment(s) to a named executive officer at, following, or in connection with the resignation, retirement or other termination of a named executive officer, or a change in control of the Company or a change in the named executive officer’s responsibilities following a change in control, see above under the heading “Employment Arrangements.”
77
Director Compensation
The following table provides information concerning the compensation paid to persons serving as non-employee directors of our Company for the fiscal year ended February 3, 2019 for whom information has not been disclosed above under the heading “Summary Compensation Table.”
| Name | Fees
Earned or Paid in Cash ($) |
Stock
Awards ($) |
Option
Awards ($) |
Non-equity
Incentive Plan Compensation ($) |
Nonqualified
Deferred Compensation Earnings ($) |
All
Other Compensation ($) |
Total
($) | |||||||
| Andrew Heyer | — | — | — | — | — | — | — | |||||||
| David Yarnell | — | — | — | — | — | — | — | |||||||
| William Phoenix | — | — | — | — | — | — | — | |||||||
| Jared Rubin | — | — | — | — | — | — | — | |||||||
| Christopher Bradley | — | — | — | — | — | — | — | |||||||
| John Grafer | — | — | — | — | — | — | — |
We currently do not have a formal non-employee director compensation policy. During fiscal 2019, we did not pay cash compensation to any non-employee director for his or her service as a director. We reimburse our non-employee directors for reasonable travel and out-of-pocket expenses incurred in connection with attending board of director and committee meetings.
PRINCIPAL AND SELLING STOCKHOLDERS
The following table sets forth, as of [●], 2019, certain information with respect to the beneficial ownership of our common stock by:
| ● | each stockholder known by us to be the beneficial owner of more than 5% of our common stock, | |
| ● | each of our current directors and Named Executive Officers, | |
| ● | all of our executive officers and directors as a group, and | |
| ● | all of the other selling stockholders. |
Beneficial ownership is determined in accordance with the rules of the SEC. These rules generally attribute beneficial ownership of securities to persons who possess sole or shared voting power or investment power with respect to such securities. Except as otherwise indicated, all persons listed below have sole voting and investment power with respect to the shares beneficially owned by them, subject to applicable community property laws. Shares of common stock subject to options or warrants currently exercisable, or exercisable within 60 days, are deemed outstanding for purposes of computing the percentage ownership of the person holding such option or warrants, but are not deemed outstanding for purposes of computing the percentage ownership of any other person. Except as disclosed in the footnotes to this table, we believe that each stockholder identified in the table possesses sole voting and investment power over all shares of common stock shown as beneficially owned by the stockholder. We have based our calculation of the percentage of beneficial ownership prior to this offering on [●] shares of our common stock outstanding as of [●], 2019. For the purposes of calculating beneficial ownership after this offering, we have assumed a full exercise of the underwriters’ option to purchase additional shares.
78
Except as otherwise noted, the address of each person or entity in the following table is c/o The Lovesac Company, Two Landmark Square, Suite 300, Stamford, Connecticut 06901.
| Prior to the Offering | Number of shares | After the Offering | ||||||||||||||||||
| Name and Address of Beneficial Owner | Number of Shares of Common Stock | Percentage Of Class | Registered for Sale Pursuant to this Prospectus(1) | Number of Shares of Common Stock | Percentage Of Class | |||||||||||||||
| Shawn Nelson | 164,508 | (2) | [●] | [●] | [●] | [●] | ||||||||||||||
| Jack A. Krause | 106,437 | (3) | [●] | [●] | [●] | [●] | ||||||||||||||
| Donna Dellomo | 59,077 | (4) | [●] | [●] | [●] | [●] | ||||||||||||||
| Andrew Heyer(5) | 5,745,212 | (6) | [●] | [●] | [●] | [●] | ||||||||||||||
| David Yarnell | - | - | - | - | - | |||||||||||||||
| William Phoenix | - | - | - | - | - | |||||||||||||||
| Jared Rubin | - | - | - | - | - | |||||||||||||||
| Christopher Bradley | - | - | - | - | - | |||||||||||||||
| John Grafer(7) | 2,350,585 | (9) | [●] | [●] | [●] | [●] | ||||||||||||||
| Directors and Officers as a group (9 individuals) | 8,425,819 | [●] | [●] | [●] | [●] | |||||||||||||||
| Beneficial Owners of more than 5% of our common stock: | ||||||||||||||||||||
| SAC Acquisition LLC | 5,244,094 | (8) | [●] | [●] | [●] | [●] | ||||||||||||||
| Entities affiliated with Mistral | 501,118 | (8) | [●] | [●] | [●] | [●] | ||||||||||||||
| Entities affiliated with Satori | 2,350,585 | (9) | [●] | [●] | [●] | [●] | ||||||||||||||
| Janus Henderson Group PLC | 1,079,965 | (10) | [●] | [●] | [●] | [●] | ||||||||||||||
| Other Selling Stockholders | ||||||||||||||||||||
| [●] | [●] | [●] | [●] | [●] | ||||||||||||||||
| * | Represents beneficial ownership of less than one percent (1%). |
| (1) | Assumes exercise of the full [●] share over-allotment by the underwriters. |
| (2) | Consists of 1,750 shares of common stock issuable upon exercise of warrants, exercisable within in 60 days of [●], 2019. |
| (3) | Consists of 525 shares of common stock issuable upon exercise of warrants, exercisable within in 60 days of [●], 2019. |
| (4) | Consists of 1,750 shares of common stock issuable upon exercise of warrants, exercisable within in 60 days of [●], 2019. |
| (5) | Mistral Sac Carry, LLC (“MSC”), an entity controlled by Mr. Heyer, is the manager of Mistral Sac Holdings 4, LLC (“MSH4”). Mistral Sac Holdings, LLC (“MSH” and, together with MSH4, the “Investing Vehicles”) is an investment entity indirectly controlled by Mr. Heyer through Mistral Equity Partners, LP (“MEP”), Mistral Equity Partners QP, LP (“MEP QP”) and MEP Co-Invest, LLC (“MEP Co-Invest”). Mistral Equity GP, LLC (“MEP GP” and, together with MEP, MEP QP, and MEP Co-Invest, the “Mistral Fund Entities”) is the general partner of MEP and MEP QP. By reason of the provisions of Rule 16a-1 of the Exchange Act, the Mistral Fund Entities may be deemed to be beneficial owners of certain of the securities that are deemed to be beneficially owned by MSH, MSC may be deemed to be the beneficial owner of any securities that may be deemed to be beneficially owned by MSH4, and Mr. Heyer may be deemed to be the beneficial owner of any securities that may be deemed to be beneficially owned by the Investing Vehicles and/or the Mistral Fund Entities. Mr. Heyer may be deemed to have an indirect pecuniary interest (within the meaning of Rule 16a-1 of the Exchange Act) in an indeterminate portion of the securities reported as beneficially owned by the Investing Vehicles, and MEP GP may be deemed to have an indirect pecuniary interest in an indeterminate portion of the securities reported as beneficially owned by MEP and MEP QP. Mr. Heyer’s business address is c/o Mistral Capital Management, LLC, 650 Fifth Avenue, 31st Floor, New York, NY 10019. |
79
| (6) | Represents 5,244,094 shares of common stock directly owned by SAC Acquisition LLC, which is indirectly controlled by Mr. Heyer through MSH, and the Mistral Fund Entities, 261,918 shares of common stock held by the Investing Vehicles and 239,200 shares of common stock issuable upon exercise of warrants held by the Investing Vehicles, exercisable within in 60 days of [●], 2019. |
| (7) | Mr. Grafer may be deemed to have an indirect pecuniary interest (within the meaning of Rule 16a-1 of the Exchange Act) in an indeterminate portion of the securities reported as beneficially owned by Satori Capital Strategic Opportunities, LP (“Satori CSO”) and Satori Capital III, LP (“SCIII”). Mr. Grafer disclaims beneficial ownership of the securities held by Satori CSO and SCIII. |
| (8) | These shares have also been included under Mr. Heyer’s name above. See footnotes 5 and 6. |
| (9) | Consists of 1,295,898 shares of common stock owned by Satori CSO and 564,687 shares of common stock owned by SCIII and 490,000 shares of common stock issuable upon exercise of warrants held by Satori CSO and SCIII, exercisable within in 60 days of [●], 2019. Satori Capital Strategic Opportunities GP, LLC (“Satori CSOGP”), is the general partner of Satori CSO and Satori Capital III GP, LLC (“SCIIIGP”), is the general partner of SCIII. SCGPM, LLC (“SCGPM”) is the manager of Satori CSOGP and SCIIIGP and may be deemed to share voting and dispositive power with respect to the shares held by Satori CSO and SCIII. SCGPM is wholly owned and controlled by Satori Capital, LLC (“Satori Capital”), which is indirectly owned and controlled by Sunny Vanderbeck and Randy Eisenman through entities that Sunny Vanderbeck or Randy Eisenman own or control. Each of Satori CSOGP, SCIIIGP, SCGPM, Satori Capital, Mr. Vanderbeck, Mr. Eisenman and each entity through which Mr. Vanderbeck and Mr. Eisenman indirectly owns or controls Satori Capital disclaims beneficial ownership of the securities held by Satori CSO and SCIII. The address for each of these entities is 2501 N. Harwood St., 20th Floor, Dallas, Texas 75201. |
| (10) | Solely based on the information included in the most recently available Schedule 13G filed with the SEC on February 12, 2019, by Janus Henderson Group PLC (“Janus Henderson”). The address for Janus Henderson listed in the Schedule 13G is 201 Bishopsgate EC2M 3AE, United Kingdom. |
Changes in Control
We are unaware of any contract or other arrangement the operation of which may at a subsequent date result in a change of control of our Company.
80
CERTAIN RELATIONSHIPS AND RELATED PARTY TRANSACTIONS
The following is a description of transactions since January 30, 2017, to which we have been a party, in which the amount involved exceeds or will exceed $120,000 and in which any of our directors, executive officers or holders of more than 5% of our capital stock, or an affiliate or immediate family member thereof, had or will have a direct or indirect material interest.
Preferred Stock Financings
In March 2017, we issued an aggregate of 1,000,000 shares of our Series A-1 Preferred Stock at a purchase price of $10.00 per share for an aggregate purchase price of $10.0 million and warrants, as amended, to purchase 350,000 shares of our common stock at an exercise price equal to the price per share of the common stock in our IPO, or $16.00. Between March 2017 and October 2017, we completed an offering of our Series A Preferred Stock and issued an aggregate of 923,000 shares of our Series A preferred stock at a purchase price of $10.00 per share for an aggregate purchase price of $9.2 million and warrants, as amended, to purchase 230,750 shares of our common stock at an exercise price of $16.00 per share. Between October 2017 and December 2017, we issued 623,500 shares of our Series A-2 Preferred Stock at a purchase price of $10.00 per share for an aggregate purchase price of $6.23 million and warrants, as amended, to purchase 218,225 shares of our common stock at an exercise price of $16.00 per share. The following table summarizes purchases of preferred stock by holders of more than five percent of our capital stock and their affiliated entities and our directors.
| Name | Series A Preferred Stock | Series A-1 Preferred Stock | Series A-2 Preferred Stock | Aggregate Purchase Price | ||||||||||||
| Shawn Nelson | — | — | 5,000 | $ | 50,000 | |||||||||||
| Jack A. Krause | — | — | 1,500 | 15,000 | ||||||||||||
| Donna Dellomo | — | — | 5,000 | 50,000 | ||||||||||||
| Entities affiliated with Satori Capital, LLC(1)(2) | — | 1,000,000 | 400,000 | 14,000,000 | ||||||||||||
| Entities affiliated with Mistral(3)(4) | 660,000 | — | 212,000 | 8,820,000 | ||||||||||||
| (1) | Consists of (a) 696,500 shares of Series A-1 Preferred Stock and 280,000 shares of Series A-2 Preferred Stock owned by Satori Capital Strategic Opportunities, LP (“Satori CSO”) and (b) 303,500 shares of Series A-1 Preferred Stock and 120,000 shares of Series A-2 Preferred Stock owned by Satori Capital III, LLC (“SCIII”). Satori Capital Strategic Opportunities GP, LLC (“Satori CSOGP”), is the general partner of Satori CSO and Satori Capital III GP, LLC (“SCIIIGP”), is the general partner of SCIII. SCGPM, LLC is the manager of Satori CSOGP and SCIIIGP and may be deemed to share voting and dispositive power with respect to the shares held by Satori CSO and SCIII. |
| (2) | Mr. Grafer, a director of the Company, is also a principal of Satori. |
| (3) | Consists of 300,000 shares of Series A Preferred Stock held by Mistral Sac Holdings LLC (“MSH”), 360,000 shares of Series A Preferred Stock owned by Mistral Sac Holdings 3, LLC (“MSH3”), and 212,000 shares of Series A-2 Preferred Stock owned by Mistral Sac Holdings 4, LLC (“MSH4”). Mistral Sac Carry, LLC (“MSC”) is the manager of MSH, MSH3 and MSH4. MSC is indirectly controlled by Mr. Heyer through Mistral Equity Partners, LP (“MEP”). By reason of the provisions of Rule 16a-1 of the Exchange Act, the Mistral Fund Entities may be deemed to be beneficial owners of certain of the securities that are deemed to be beneficially owned by MSH, MSH3 MSH4, and Mr. Heyer may be deemed to be the beneficial owner of any securities that may be deemed to be beneficially owned by MSH, MSH3, MSH4 and/or MSC. Mr. Heyer may be deemed to have an indirect pecuniary interest (within the meaning of Rule 16a-1 of the Exchange Act) in an indeterminate portion of the securities reported as beneficially owned by MSH, MSH3 and MSH4 and may be deemed to have an indirect pecuniary interest in an indeterminate portion of the securities reported as beneficially owned by MSC. |
| (4) | Messrs. Bradley, Heyer and Phoenix, each of whom is a director of the Company, are also principals of Mistral. Mr. Phoenix is also a director of Blueport Commerce, which is owned in part by investment vehicles affiliated with Mistral. |
81
On April 19, 2018, we amended and restated the terms of our preferred stock to, among other things, revise the conversion features of the preferred stock. Immediately prior to the closing of our IPO, the preferred stock (i) accrued an additional amount of dividends equal to the amount of dividends that would have accrued and accumulated through and including the one year anniversary of the completion of our IPO, and (ii) automatically converted, along with the aggregate accrued or accumulated and unpaid dividends thereon, into shares of common stock.
On April 19, 2018, we agreed to amend and restate the warrants issued to our preferred stockholders. As a result, the warrants were amended to be set at a fixed number of shares with an exercise price of $16.00 per share.
Registration Rights Agreement
In connection with the preferred stock financings discussed above we have entered into amended and restated registration rights agreements with each investor in the financing, including entities affiliated with Satori and Mistral. As described in more detail below, the registration rights agreements provide the holders of preferred stock and the common stock warrants issued in connection therewith with piggyback and demand registration rights as to the common stock issuable upon conversion of the preferred stock and exercise of the common stock warrants. See the section titled “Description of Capital Stock-Registration Rights” for additional information.
Monitoring and Management Services Agreements
On May 24, 2010, Sac Acquisition LLC and Mistral Capital Management, LLC, or Mistral, entered into a monitoring and management services agreement, as amended on January 25, 2016, (the “Monitoring Agreement”). The Monitoring Agreement was subsequently assumed by the Company, along with Sac Acquisition LLC’s other liabilities. Certain of our directors are members and principals of Mistral. Pursuant to the terms of the Monitoring Agreement, Mistral agreed to provide certain monitoring and financial advisory services in exchange for an annual fee of $400,000 (the “Monitoring Fee”) and the reimbursement of reasonable out-of-pocket expenses incurred in connection with the performance of services under the Monitoring Agreement. The Monitoring Agreement provides for customary exculpation and indemnification provisions in favor of Mistral and each of its affiliates and automatically renews on an annual basis unless terminated by Mistral.
Pursuant to the Monitoring Agreement, Mistral was also entitled to a fee of $500,000 in connection with the refinancing of the Company’s credit agreement. This fee was paid at the closing of our IPO.
The parties amended and restated the Monitoring Agreement effective upon the consummation of our IPO (the “A&R Monitoring Agreement”). Under the arrangement, Mistral agreed to terminate its right of first offer to act as financial advisor to the Company and, for so long as Mistral is receiving the Monitoring Fee, Mistral agreed that none of its officers or employees will accept cash director fees from the Company for their service as directors of the Company. The Monitoring Fee will continue at its current rate during the term of the A&R Monitoring Agreement. The A&R Monitoring Agreement will terminate on January 31, 2021.
For services rendered under the Monitoring Agreement, Mistral received fees totaling $900,000 during fiscal 2019, which included the $500,000 fee paid at the closing of the IPO, and $400,000 in fiscal 2018.
On March 30, 2017, the Company and Satori Capital, LLC, or Satori, entered into a letter agreement pursuant to which, among other things, Satori would provide certain monitoring and financial advisory services in exchange for an annual fee of $100,000 and the reimbursement of reasonable out-of-pocket expenses incurred in connection with the performance of services under the agreement. The letter agreement provided for customary exculpation and indemnification provisions in favor of Satori and each of their respective affiliates. Satori’s monitoring and financial advisory services fees will terminate at the same time as the A&R Monitoring Agreement.
On June 22, 2018, the Company and Satori amended the letter agreement, to grant to Satori 50,000 shares of common stock, in connection with the performance of services to the Company. In addition, pursuant to Satori’s letter agreement, Satori was paid a fee of $125,000 at the same time that Mistral was paid its fee relating to refinancing of the Company’s credit agreement.
82
For services rendered to the Company, Satori received fees totaling $225,000, which included the $125,000 fee referenced above, and a one-time stock grant of 50,000 shares of our common stock in fiscal 2019 and $83,888 in fiscal 2018.
Blueport Commerce Agreement
On November 16, 2016, the Company engaged Blueport Commerce (“Blueport”), a company owned in part by investment vehicles affiliated with Mistral and an affiliate of Schottenstein Stores Corporation, an indirect investor in Sac Acquisition LLC, to evaluate a transition plan to convert to the Blueport platform. Certain of our directors are members and principals of Mistral or employees of Schottenstein Stores Corporation. Mr. Phoenix and Mr. Rubin, directors of the Company, are also directors of Blueport. The Company launched on the Blueport platform in February 2018. There were $1,153,844 of fees incurred with Blueport for the conversion to, and sales transacted through, the Blueport platform during fiscal 2019. Transition plan fees of $0 and $15,235 were incurred with Blueport during fiscal 2019 and fiscal 2018, respectively.
Employment Agreements
We have entered into employment agreements with certain of our executive officers. See “Executive Compensation-Employment Arrangements.”
Related Party Transactions Policy
We have adopted a policy with respect to the review, approval and ratification of related party transactions. Under the policy, the audit committee is responsible for reviewing and approving related party transactions. The policy applies to transactions, arrangements and relationships (including any indebtedness or guarantee of indebtedness) or any series of similar transactions, arrangements or relationships in which the aggregate amount involved will, or may be expected to, exceed $120,000 with respect to any fiscal year, and in which we (or one of our subsidiaries) are a participant and in which a related party has or will have a direct or indirect material interest. In the course of reviewing potential related party transactions, the audit committee will consider the nature of the related party’s interest in the transaction; the presence of standard prices, rates or charges or terms otherwise consistent with arms-length dealings with unrelated third parties; the materiality of the transaction to each party; the reasons for the Company entering into the transaction with the related party; the potential effect of the transaction on the status of a director as an independent, outside or disinterested director or committee member; and any other factors the audit committee may deem relevant.
83
General
The following description of our capital stock and certain provisions of our certificate of incorporation, certificates of designation and bylaws are summaries and are qualified by reference to our amended and restated certificate of incorporation, applicable certificate of designation and amended and restated bylaws. Copies of these documents are filed with the SEC. See “Where You Can Find More Information.”
We are authorized to issue 40,000,000 shares of common stock, par value $.00001 per share, and 10,000,000 shares of preferred stock, par value $0.00001 per share.
Common Stock
As of [●], 2019, we had [●] shares of common stock issued and outstanding.
Voting Rights
The holders of our common stock are entitled to one vote for each share held of record on all matters submitted to a vote of the stockholders, including the election of directors, and do not have cumulative voting rights. Accordingly, the holders of a majority of the outstanding shares of common stock entitled to vote in any election of directors can elect all of the directors standing for election, if they so choose, other than any directors that holders of any preferred stock we may issue may be entitled to elect.
Dividends
Subject to limitations under Delaware law and preferences that may be applicable to any then outstanding preferred stock, holders of common stock are entitled to receive ratably those dividends, if any, as may be declared by our board of directors out of legally available funds.
Liquidation
In the event of any voluntary or involuntary liquidation, dissolution or winding up of our affairs, the holders of our common stock will be entitled to share ratably in the net assets legally available for distribution to stockholders after the payment of or provision for all of our debts and other liabilities, subject to the prior rights of any preferred stock then outstanding, including without limitation, the liquidation preference payable to holders of our Preferred A Shares (as defined below).
Rights and Preferences
Holders of common stock have no preemptive or conversion rights or other subscription rights and there are no redemption or sinking funds provisions applicable to the common stock.
Fully Paid and Non-assessable
All outstanding shares of common stock are duly authorized, validly issued, fully paid and non-assessable.
Preferred Stock
On June 29, 2018, in connection with our IPO, all outstanding preferred stock automatically converted into common stock. There are no shares of preferred stock issued or outstanding.
Our board of directors has the authority, without further action by our stockholders, to authorize and issue up to 10,000,000 shares of preferred stock in one or more series and to fix the rights, preferences, privileges and restrictions thereof. These rights, preferences and privileges could include dividend rights, conversion rights, voting rights, terms of redemption, liquidation preferences, sinking fund terms and the number of shares constituting, or the designation of, such series, any or all of which may be greater than the rights of common stock. The issuance of any additional preferred stock could adversely affect the voting power of holders of common stock and the likelihood that such holders will receive dividend payments and payments upon our liquidation. In addition, the issuance of any additional preferred stock could have the effect of delaying, deferring or preventing a change in control of our Company or other corporate action. Each of the foregoing could harm the market price of our common stock.
84
Warrants
We have issued and outstanding three series of common stock warrants in connection with prior preferred stock financings: (i) Series A Warrants, as amended, to purchase 230,750 shares of common stock, (ii) Series A-1 Warrants, as amended, to purchase 350,000 shares of common stock, and (iii) Series A-2 Warrants, as amended, to purchase 218,225 shares of common stock, (collectively, the “Warrants”). Upon, exercise, the holders of the Warrants can purchase shares of common stock at a price equal to $16.00 per share.
Each Warrant expires on the earlier of (a) the third (3rd) anniversary of June 29, 2018, (b) the fifth (5th) anniversary of the applicable Warrant issue date, or (c) the occurrence of a deemed liquidation of the Company. The Warrants allow for cashless exercise only in the event that the underlying shares are not registered or qualified for resale. The Company may force the holders to exercise their Warrant or the Company may redeem each Warrant for a nominal price if, at any time following the one-year anniversary of the issuance of such Warrant, (i) the Company has been listed on a national securities exchange, (ii) the common stock underlying the warrants have been registered or qualified for resale or the holders otherwise have the ability to trade the underlying common shares without restriction following a cash exercise, (iii) the 30-day volume-weighted daily average price of the Company’s common stock exceeds 200% of the exercise price of the Warrants, as equitably adjusted for any stock splits, dividends or transactions having a similar effect, and (iv) the average daily trading volume is at least 200,000 shares of common stock during the 30-day period prior to the forced exercise or redemption.
In connection with our IPO, we issued to Roth Capital Partners, LLC, as the representative of the underwriters, a warrant initially exercisable for up to 281,750 shares of common stock. The warrant is exercisable at a per share price equal to $19.20. The warrant is exercisable at any time, and from time to time, in whole or in part, until the fifth anniversary of our IPO, in compliance with FINRA Rule 5110(f)(2)(G)(i). The warrant and the shares of common stock underlying the warrant have been deemed compensation by FINRA and were therefore subject to a 180 day lock-up. Roth Capital Partners, LLC (or its permitted assignees) were not permitted to sell, transfer, assign, pledge or hypothecate the warrant or the securities underlying the warrant, nor engage in any hedging, short sale, derivative, put, or call transaction that would result in the effective economic disposition of the warrant or the underlying securities for the period ending on, and including, December 23, 2018. The exercise price and number of shares of common stock issuable upon exercise of the warrant will be adjusted in certain circumstances, including in the event of a stock dividend, cash dividend or our recapitalization, reorganization, merger or consolidation.
Stockholder Registration Rights
We are party to an amended and restated registration rights agreement which provides that holders of our Preferred A Shares (the “Holders”) have certain registration rights as to the common stock issuable upon exercise of the Preferred A Shares and the Warrants, as set forth below. This registration rights agreement was entered into in connection with our preferred stock financing in 2017. The registration of shares of our common stock pursuant to the exercise of registration rights described below would enable the holders to sell these shares without restriction under the Securities Act when the applicable registration statement is declared effective. We will pay the registration expenses, other than underwriting discounts and selling commissions, of the shares registered pursuant to the demand, piggyback and Form S-3 registrations described below.
Generally, in an underwritten offering, the managing underwriter, if any, has the right, subject to specified conditions, to limit the number of shares such Holders may include and require the Holders enter into customary lock-up agreements.
85
Piggyback Registration Rights
With certain exceptions, in the event that we propose to register any of our securities under the Securities Act following this offering, either for our own account or for the account of other security holders, the Holders will be entitled to certain “piggyback” registration rights, subject to certain marketing and other limitations. As a result, whenever we propose to file a registration statement under the Securities Act, other than with respect to a demand registration or a registration statement on Forms S-4 or S-8, the Holders will be entitled to notice of the registration and have the right, subject to limitations that the underwriter may impose on the number of shares included in the registration, to include their Registrable Securities in the registration.
Demand Registration Rights
We agreed to use reasonable best efforts to qualify and remain qualified to register the offer and sale of securities pursuant to a registration statement on Form S-3 or any similar short-form registration statement or successor form (“Short-Form Registration Statement”), beginning one (1) year after the closing of our IPO. When we have qualified to register the offer and sale of securities on a Short-Form Registration Statement, the Holders may require us to register all or any portion of their Registrable Securities, in an unlimited number of registrations, pursuant to such Short-Form Registration Statement.
Anti-Takeover Effects of Provisions of Our Certificate of Incorporation, Our Bylaws and Delaware Law
Certain provisions of Delaware law, our amended and restated certificate of incorporation and our amended and restated bylaws contain provisions that could make the following transactions more difficult: an acquisition of us by means of a tender offer; a proxy contest; or the removal of our incumbent officers and directors. It is possible that these provisions could make it more difficult to accomplish or could deter transactions that stockholders may otherwise consider to be in their best interest or in our best interest, including transactions which provide for payment of a premium over the market price for our shares.
These provisions, summarized below, are intended to discourage coercive takeover practices and inadequate takeover bids. These provisions are also designed to encourage persons seeking to acquire control of us to first negotiate with our board of directors. We believe that the benefits of the increased protection of our potential ability to negotiate with the proponent of an unfriendly or unsolicited proposal to acquire or restructure us outweigh the disadvantages of discouraging these proposals because negotiation of these proposals could result in an improvement of their terms.
Authorized but Unissued Shares
Our authorized but unissued shares of common stock and preferred stock are available for future issuance without stockholder approval. These additional shares may be utilized for a variety of corporate purposes, including future public offerings to raise additional capital and corporate acquisitions. The existence of authorized but unissued shares of common stock and preferred stock could render more difficult or discourage an attempt to obtain control of a majority of our common stock by means of a proxy contest, tender offer, merger or otherwise.
Appointment and Removal of Directors
Our certificate of incorporation and our bylaws provide that any vacancies resulting from death, resignation, disqualification, removal or other causes and newly created directorships resulting from any increase in the number of directors shall be filled only by the affirmative vote of a majority vote of the directors then in office, unless the board of directors determines such vacancy shall be filled by stockholders. This provision restricting the filling of vacancies will prevent a stockholder from increasing the size of our board of directors and gaining control of our board of directors by filling the resulting vacancies with its own nominees. In addition, our certificate of incorporation and our bylaws provide that a member of our board of directors may be removed with or without cause by the vote of the holders of a majority of the voting power of all then-outstanding shares of capital stock of the Company entitled to vote generally at an election of directors.
86
Advance Notice Procedures
Our certificate of incorporation and our bylaws establish an advance notice procedure for stockholder proposals to be brought before an annual meeting of our stockholders, including proposed nominations of persons for election to the board of directors. Stockholders at an annual meeting will only be able to consider proposals or nominations specified in the notice of meeting or brought before the meeting by or at the direction of the board of directors or by a stockholder who was a stockholder of record on the record date for the meeting, who is entitled to vote at the meeting and who has given our Secretary timely written notice, in proper form, of the stockholder’s intention to bring that business before the meeting. Although our bylaws do not give the board of directors the power to approve or disapprove stockholder nominations of candidates or proposals regarding other business to be conducted at a special or annual meeting, our bylaws may have the effect of precluding the conduct of certain business at a meeting if the proper procedures are not followed or may discourage or deter a potential acquirer from conducting a solicitation of proxies to elect its own slate of directors or otherwise attempting to obtain control of the Company.
Delaware Anti-Takeover Statute
We are subject to Section 203 of the Delaware General Corporation Law (“DGCL”), which prohibits persons deemed to be “interested stockholders” from engaging in a “business combination” with a publicly held Delaware corporation for three years following the date these persons become interested stockholders unless the business combination is, or the transaction in which the person became an interested stockholder was, approved in a prescribed manner or another prescribed exception applies. Generally, an “interested stockholder” is a person who, together with affiliates and associates, owns, or within three years prior to the determination of interested stockholder status did own, 15% or more of a corporation’s voting stock. Generally, a “business combination” includes a merger, asset or stock sale, or other transaction resulting in a financial benefit to the interested stockholder. The existence of this provision may have an anti-takeover effect with respect to transactions not approved in advance by the board of directors. A Delaware corporation may “opt out” of these provisions with an express provision in its original certificate of incorporation or an express provision in its certificate of incorporation or bylaws resulting from a stockholders’ amendment approved by at least a majority of the outstanding voting shares. We have not opted out of these provisions. As a result, mergers or other takeover or change in control attempts of us may be discouraged or prevented.
Limitation on Director’s Liability
Our certificate of incorporation and bylaws require us to indemnify our directors to the fullest extent permitted by the DGCL. The DGCL permits a corporation to limit or eliminate a director’s personal liability to the corporation or the holders of its capital stock for breach of duty. This limitation is generally unavailable for acts or omissions by a director which (i) were in bad faith, (ii) were the result of active and deliberate dishonesty and were material to the cause of action so adjudicated or (iii) involved a financial profit or other advantage to which such director was not legally entitled. The DGCL also prohibits limitations on director liability for acts or omissions which result in a violation of a statute prohibiting certain dividend declarations, certain payments to stockholders after dissolution and particular types of loans. We adopted these limitation on our directors’ personal liability to the Company and our stockholders to the maximum extent permitted under Delaware law. The effect of these provisions is to eliminate the rights of our Company and our stockholders (through stockholders’ derivative suits on behalf of our Company) to recover monetary damages against a director for breach of fiduciary duty as a director (including breaches resulting from grossly negligent behavior), except in the situations described above. These provisions do not limit the liability of directors under the federal securities laws of the United States.
Exchange Listing
Our common stock is listed on Nasdaq under the symbol “LOVE.”
Transfer Agent and Registrar
The transfer agent and registrar for our common stock is American Stock Transfer & Trust Company, LLC.
87
SHARES ELIGIBLE FOR FUTURE SALE
Future sales of substantial amounts of our common stock in the public market could adversely affect prevailing market prices of our common stock from time to time and could impair our ability to raise equity capital in the future.
A total of 13,588,568 shares of our common stock were outstanding as of February 3, 2019. Of these shares, the 4,050,000 shares of common stock sold in the IPO are freely tradable, 2,220,000 shares of common stock sold in the October 2018 secondary offering are freely tradable and the [●] shares of common stock sold in this offering will be freely tradable immediately upon consummation of this offering, unless held by our affiliates, as that term is defined under Rule 144 under the Securities Act (“Rule 144”), or subject to lock-up agreements. The remaining shares of common stock outstanding upon the closing of this offering are restricted securities as defined in Rule 144. Restricted securities may be sold in the U.S. public market only if registered or if they qualify for an exemption from registration, including by reason of Rule 144 or Rule 701 under the Securities Act (“Rule 701”), which rules are summarized below. Subject to the lock-up arrangements described below and the provisions of Rule 144, these restricted securities will be available for sale in the public market after the date of this prospectus.
We may issue shares of common stock from time to time as consideration for future acquisitions, investments or other corporate purposes. In the event that any such acquisition, investment or other transaction is significant, the number of shares of common stock that we may issue may in turn be significant. We may also grant registration rights covering those shares of common stock issued in connection with any such acquisition and investment.
In addition, the shares of common stock reserved for future issuance under the Equity Plan will become eligible for sale in the public market to the extent permitted by the provisions of various vesting schedules, the lock-up agreements, a registration statement under the Securities Act or an exemption from registration, including Rule 144 and Rule 701.
Rule 144
In general, a person who has beneficially owned restricted shares of our common stock for at least six months would be entitled to sell their securities provided that (1) such person is not deemed to have been one of our affiliates at the time of, or at any time during the 90 days preceding, a sale, (2) we have been subject to the Exchange Act periodic reporting requirements for at least 90 days before the sale, and (3) we are current in our Exchange Act reporting at the time of sale.
Persons who have beneficially owned restricted shares of our common stock for at least six months but who are our affiliates at the time of or any time during the 90 days preceding, a sale, would be subject to additional restrictions, by which such person would be entitled to sell within any three-month period only a number of securities that does not exceed the greater of either of the following:
| ● | 1% of the number of shares of our common stock then outstanding, which will equal approximately [●] shares immediately after the closing of this offering based on the number of common shares outstanding as of [●], 2019. | |
| ● | the average weekly trading volume of our common stock during the four calendar weeks preceding the filing of a notice on Form 144 with respect to the sale. |
Such sales by affiliates must also comply with the manner of sale, current public information and notice provisions of Rule 144.
Rule 701
In general, under Rule 701 a person who purchased shares of our common stock pursuant to a written compensatory plan or contract and who is not deemed to have been one of our affiliates during the immediately preceding 90 days may sell these shares in reliance upon Rule 144, but without being required to comply with the notice, manner of sale, public information requirements or volume limitation provisions of Rule 144. Rule 701 also permits affiliates to sell their Rule 701 shares under Rule 144 without complying with the holding period requirements of Rule 144.
88
Form S-8 Registration Statements
We intend to file with the SEC a registration statement on Form S-8 under the Securities Act to register the offer and sale of shares of our common stock that are issuable pursuant to the Equity Plan. This registration statement will become effective immediately upon filing. Shares covered by these registration statements will then be eligible for sale in the public markets, subject to vesting restrictions, any applicable lock-up agreements described below and Rule 144 limitations applicable to affiliates.
Lock-Up Arrangements
In connection with this offering, we, our directors and officers and the selling stockholders have agreed with Stifel, Nicolaus & Company, Incorporated, the sole book-running manager, that, during the period ending on, and including, the 90th day following the date of this prospectus, we and they will not, directly or indirectly, offer, sell, contract to sell, pledge, grant any option to purchase, make any short sale, or otherwise dispose of or hedge any of our shares of common stock, any options or warrants to purchase shares of our common stock, or any securities convertible into, or exchangeable for or that represent the right to receive shares of our common stock, subject to certain exceptions. These agreements are more fully described in the section of this prospectus titled “Underwriting.”
Registration Rights
The holders of [●] shares of common stock and [●] shares of common stock issuable upon the exercise of outstanding warrants, or their transferees, are entitled to certain rights with respect to the registration of the offer and sale of common stock issuable upon conversion of such shares of common stock under the Securities Act. Registration of these shares under the Securities Act would result in the shares becoming freely tradable without restriction under the Securities Act immediately upon the effectiveness of the registration. See the section titled “Description of Capital Stock-Stockholder Registration Rights” for additional information.
MATERIAL
UNITED STATES FEDERAL INCOME TAX CONSEQUENCES
TO NON-U.S. HOLDERS OF OUR COMMON STOCK
The following discussion describes the material U.S. federal income tax consequences of the acquisition, ownership and disposition of our common stock acquired in this offering by Non-U.S. Holders (as defined below). This discussion does not address all aspects of U.S. federal income taxes, does not discuss the potential application of the alternative minimum or Medicare contribution tax on net investment income, and does not deal with state, local or non-U.S. tax consequences that may be relevant to Non-U.S. Holders in light of their particular circumstances, nor does it address U.S. federal tax consequences other than income taxes (not addressed, for example, are gift and estate taxes). Rules different from those described below may apply to certain Non-U.S. Holders that are subject to special treatment under the Code, such as financial institutions, insurance companies, tax-exempt organizations, “foreign governments,” international organizations, broker-dealers and traders in securities, U.S. expatriates, “controlled foreign corporations,” “passive foreign investment companies,” corporations that accumulate earnings to avoid U.S. federal income tax, persons that hold our common stock as part of a “straddle,” “conversion transaction,” or other risk reduction strategy, partnerships and other pass-through entities, and investors in such partnerships or pass-through entities (regardless of their places of organization or formation). Such Non-U.S. Holders are urged to consult their own tax advisors to determine the U.S. federal, state, local and other tax consequences that may be relevant to them. Furthermore, the discussion below is based upon the provisions of the Code, and Treasury regulations, rulings and judicial decisions thereunder as of the date hereof, and such authorities may be repealed, revoked or modified, perhaps retroactively, so as to result in U.S. federal income or estate tax consequences different from those discussed below. We have not requested a ruling from the IRS with respect to the statements made and the conclusions reached in the following summary. This discussion assumes that the Non-U.S. Holder holds our common stock as a “capital asset” within the meaning of Section 1221 of the Code (generally, property held for investment).
89
Persons considering the purchase of our common stock pursuant to this offering should consult their own tax advisors concerning the U.S. federal income consequences of acquiring, owning and disposing of our common stock in light of their particular situations as well as any consequences arising under the laws of any other taxing jurisdiction, including any state, local and non-U.S. tax consequences and any U.S. federal non-income tax consequences.
For the purposes of this discussion, a “Non-U.S. Holder” is, for U.S. federal income tax purposes, a beneficial owner of common stock that is not a U.S. Holder. A “U.S. Holder” means a beneficial owner of our common stock that is for U.S. federal income tax purposes (a) an individual who is a citizen or resident of the United States, (b) a corporation or other entity treated as a corporation created or organized in or under the laws of the United States, any state thereof or the District of Columbia, (c) an estate the income of which is subject to U.S. federal income taxation regardless of its source or (d) a trust if it (1) is subject to the primary supervision of a court within the United States and one or more U.S. persons have the authority to control all substantial decisions of the trust or (2) has a valid election in effect under applicable U.S. Treasury regulations to be treated as a U.S. person. Also, partnerships, or other entities that are treated as partnerships for U.S. federal income tax purposes (regardless of their place of organization or formation), are not addressed by this discussion and are, therefore, not considered to be Non-U.S. Holders for the purposes of this discussion. If a partnership, including any entity or arrangement treated as a partnership for U.S. federal income tax purposes, holds shares of our common stock, the U.S., federal income tax treatment of a partner in such partnership will generally depend upon the status of the partner, the activities of the partnership and certain determinations made at the partner level. Such partners and partnerships should consult their own tax advisors regarding the tax consequences of the purchase, ownership and disposition of our common stock.
Distributions
Subject to the discussion below regarding backup withholding and foreign accounts, distributions, if any, made on our common stock to a Non-U.S. Holder of our common stock generally will constitute dividends for U.S. tax purposes to the extent made out of our current or accumulated earnings and profits (as determined under U.S. federal income tax principles) and generally will be subject to withholding tax at a 30% rate or such lower rate as may be specified by an applicable income tax treaty. To obtain a reduced rate of withholding under a treaty, a Non-U.S. Holder generally will be required to provide us with a properly executed Internal Revenue Service (“IRS”), Form W-8BEN, W-8BEN-E or other appropriate form, certifying the Non-U.S. Holder’s entitlement to benefits under that treaty. This certification must be provided to us or our paying agent prior to the payment of dividends.
In the case of a Non-U.S. Holder that is an entity, Treasury Regulations and the relevant tax treaty provide rules to determine whether, for purposes of determining the applicability of a tax treaty, dividends will be treated as paid to the entity or to those holding an interest in that entity. If a Non-U.S. Holder holds stock through a financial institution or other agent acting on the holder’s behalf, the holder will be required to provide appropriate documentation to such agent. The holder’s agent may then be required to provide certification to us or our paying agent, either directly or through other intermediaries. If you are eligible for a reduced rate of U.S. federal withholding tax under an income tax treaty, you should consult with your own tax advisor to determine if you are able to obtain a refund or credit of any excess amounts withheld by timely filing an appropriate claim for a refund with the IRS.
Withholding tax is generally not imposed on dividends paid to a Non-U.S. Holder that are effectively connected with the Non-U.S. Holder’s conduct of a trade or business within the United States (and, if required by an applicable income tax treaty, are attributable to a permanent establishment that such holder maintains in the United States) if a properly executed IRS Form W-8ECI, stating that the dividends are so connected, is furnished to us (or, if stock is held through a financial institution or other agent, to such agent). In general, such effectively connected dividends will be subject to U.S. federal income tax, on a net income basis at the regular graduated rates. A Non-U.S. Holder that is a corporation for U.S. federal income tax purposes that receives effectively connected dividends may also be subject to an additional “branch profits tax,” which is imposed, under certain circumstances, at a rate of 30% (or such lower rate as may be specified by an applicable treaty) on the corporate Non-U.S. Holder’s effectively connected earnings and profits, subject to certain adjustments.
90
To the extent distributions on our common stock, if any, exceed our current and accumulated earnings and profits, they will first reduce your adjusted basis in our common stock as a non-taxable return of capital, but not below zero, and then any excess will be treated as gain and taxed in the same manner as gain realized from a sale or other disposition of common stock as described in the next section.
Gain on Disposition of Our Common Stock
Subject to the discussions below regarding backup withholding and foreign accounts, a Non-U.S. Holder generally will not be subject to U.S. federal income tax with respect to gain realized on a sale or other disposition of our common stock unless (a) the gain is effectively connected with a trade or business of such holder in the United States (and, if required by an applicable income tax treaty, is attributable to a permanent establishment that such holder maintains in the United States), (b) the Non-U.S. Holder is a nonresident alien individual and is present in the United States for 183 or more days in the taxable year of the disposition and certain other conditions are met, or (c) we are or have been a “United States real property holding corporation” within the meaning of Code Section 897(c)(2) at any time within the shorter of the five-year period preceding such disposition or such holder’s holding period.
If you are a Non-U.S. Holder described in (a) above, you generally will be required to pay tax on the net gain derived from the sale at regular graduated U.S. federal income tax rates and corporate Non-U.S. Holders described in (a) above may be subject to the additional branch profits tax at a 30% rate or such lower rate as may be specified by an applicable income tax treaty. If you are an individual Non-U.S. Holder described in (b) above, you will be required to pay a flat 30% tax on the gain derived from the sale, which gain may be offset by U.S. source capital losses (even though you are not considered a resident of the United States). With respect to (c) above, in general, we would be a United States real property holding corporation if interests in U.S. real estate constituted (by fair market value) at least half of our total worldwide real property interests plus business assets. We believe that we are not, and do not anticipate becoming, a United States real property holding corporation; however, there can be no assurance that we will not become a U.S. real property holding corporation in the future. Even if we are treated as a U.S. real property holding corporation, such treatment will not cause gain realized by a Non-U.S. Holder on a disposition of our common stock to be subject to U.S. federal income tax so long as (1) the Non-U.S. Holder owned, directly, indirectly and constructively, no more than five percent of our common stock at all times within the shorter of (i) the five-year period preceding the disposition or (ii) the holder’s holding period and (2) our common stock is regularly traded on an established securities market. There can be no assurance that our common stock will qualify as regularly traded on an established securities market.
Information Reporting Requirements and Backup Withholding
Generally, we or certain financial middlemen must report information to the IRS with respect to any dividends we pay on our common stock including the amount of any such dividends, the name and address of the recipient, and the amount, if any, of tax withheld. A similar report is sent to the holder to whom any such dividends are paid. Pursuant to tax treaties or certain other agreements, the IRS may make its reports available to tax authorities in the recipient’s country of residence.
Dividends paid by us (or certain financial middlemen) to a Non-U.S. Holder may also be subject to U.S. backup withholding. U.S. backup withholding generally will not apply to a Non-U.S. Holder who provides a properly executed appropriate IRS Form W-8 or otherwise establishes an exemption. Notwithstanding the foregoing, backup withholding may apply if the payor has actual knowledge, or reason to know, that the holder is a U.S. person who is not an exempt recipient.
Under current U.S. federal income tax law, U.S. information reporting and backup withholding requirements generally will apply to the proceeds of a disposition of our common stock effected by or through a U.S. office of any broker, U.S. or non-U.S., unless the holder provides a properly executed IRS Form W-8BEN or IRS Form W-8BEN-E, as applicable, or otherwise establishes an exemption. Generally, U.S. information reporting and backup withholding requirements will not apply to a payment of disposition proceeds to a Non-U.S. Holder where the transaction is considered effected outside the United States through a non-U.S. office of a non-U.S. broker. Information reporting and backup withholding requirements may, however, apply to a payment of disposition proceeds if the broker has actual knowledge, or reason to know, that the holder is, in fact, a U.S. person. For information reporting purposes, certain brokers with substantial U.S. ownership or operations will generally be treated in a manner similar to U.S. brokers.
91
If backup withholding is applied to you, you should consult with your own tax advisor to determine if you are able to obtain a tax refund or credit with respect to the amount withheld.
Foreign Accounts
A U.S. federal withholding tax of 30% may apply to dividends and, for any disposition occurring on or after January 1, 2019, the gross proceeds of a disposition of our common stock paid to a foreign financial institution (as specifically defined by applicable rules), including when the foreign financial institution holds our common stock on behalf of a Non-U.S. Holder, unless such institution enters into an agreement with the U.S. government to withhold on certain payments and to collect and provide to the U.S. tax authorities substantial information regarding U.S. account holders of such institution (which includes certain equity holders of such institution, as well as certain account holders that are foreign entities with U.S. owners). This U.S. federal withholding tax of 30% will also apply to dividends and, for any disposition occurring on or after January 1, 2019, the gross proceeds of a disposition of our common stock paid to a non-financial foreign entity unless such entity provides the withholding agent with either a certification that it does not have any substantial direct or indirect U.S. owners or provides information regarding direct and indirect U.S. owners of the entity. The withholding tax described above will not apply if the foreign financial institution or non-financial foreign entity otherwise qualifies for an exemption from the rules. An intergovernmental agreement between the U.S. and an applicable foreign country may modify these requirements. Under certain circumstances, a Non-U.S. Holder might be eligible for refunds or credits of such taxes. Holders are encouraged to consult with their own tax advisors regarding the possible implications of this withholding tax on their investment in our common stock.
EACH PROSPECTIVE INVESTOR SHOULD CONSULT HIS, HER OR ITS OWN TAX ADVISOR REGARDING THE TAX CONSEQUENCES OF PURCHASING, HOLDING AND DISPOSING OF OUR COMMON STOCK, INCLUDING THE CONSEQUENCES OF ANY PROPOSED CHANGE IN APPLICABLE LAW, AS WELL AS TAX CONSEQUENCES ARISING UNDER ANY STATE, LOCAL, NON-U.S. OR U.S. FEDERAL NON-INCOME TAX LAWS.
We and the selling stockholders have entered into an underwriting agreement with Stifel, Nicolaus & Company, Incorporated, acting as the representative for the underwriters named below. We will not receive any proceeds from the sale of common stock by the selling stockholders. In connection with this offering and subject to certain terms and conditions, each of the underwriters named below has severally agreed to purchase, and we and the selling stockholders have agreed to sell, the number of shares of common stock set forth opposite the name of each underwriter:
| Underwriter | Number of Shares of Common Stock | |||
| Stifel, Nicolaus & Company, Incorporated | [●] | |||
| [●] | [●] | |||
| [●] | [●] | |||
| Total | [●] |
The underwriting agreement provides that the obligation of the underwriters to purchase the shares of common stock offered by this prospectus is subject to certain conditions. The underwriters are obligated to purchase all of the shares of common stock offered hereby if any of the shares are purchased.
Certain of the selling stockholders have granted the underwriters an option to buy up to an additional [●] shares of common stock from such selling stockholders at the public offering price, less the underwriting discounts, to cover over-allotments, if any. The underwriters may exercise this option at any time, in whole or in part, during the 30-day period after the date of this prospectus. To the extent the option is exercised, each underwriter will become obligated, subject to certain conditions, to purchase the same percentage of the additional shares of common stock as the number listed next to the underwriters’ name in the preceding table bears to the total number of shares of common stock listed next to the names of all underwriters in the preceding table.
92
Discounts, Commissions and Expenses
The underwriters propose to offer the shares of common stock purchased pursuant to the underwriting agreement to the public at the public offering price set forth on the cover page of this prospectus and to certain dealers at that price less a concession not in excess of $[●] per share. After this offering, the public offering price and concession may be changed by the underwriters.
In connection with the sale of the common stock to be purchased by the underwriters, the underwriters will be deemed to have received compensation in the form of underwriting discounts. The underwriters’ discount will be $[●] per share of common stock.
The estimated total expenses of the offering, excluding the underwriting discount, will be approximately $[●] and are payable by us. We may reimburse Stifel, Nicolaus & Company, Incorporated at closing for legal expenses incurred by it in connection with the offering up to a maximum of $[●]. We also have agreed to reimburse the selling stockholders at closing for reasonable legal expenses incurred by them in connection with the offering.
The following table shows the underwriting discounts payable to the underwriters by us and the selling stockholders in connection with this offering (assuming both the exercise and non-exercise of the over-allotment option to purchase additional shares of common stock certain of the selling stockholders have granted to the underwriter):
| Total | ||||||||||||
| Per Share | Without Over- allotment | With Over- allotment | ||||||||||
| Public offering price | $ | |||||||||||
| Underwriting discounts paid by us | $ | |||||||||||
| Underwriting discounts paid by the selling stockholders | $ | |||||||||||
Indemnification
Pursuant to the underwriting agreement, we have agreed to indemnify the underwriters against certain liabilities, including liabilities under the Securities Act, or to contribute to payments that the underwriters or such other indemnified parties may be required to make in respect of those liabilities.
Lock-Up Agreements
We have agreed not to (i) offer, pledge, issue, sell, contract to sell, purchase, contract to purchase, lend or otherwise transfer or dispose of, directly or indirectly, any shares of our common stock or any securities convertible into or exercisable or exchangeable for our common stock; (ii) enter into any swap or other arrangement that transfers, in whole or in part, any of the economic consequences of ownership of shares of common stock; or (iii) file any registration statement with the SEC relating to the offering of any shares of our common stock or any securities convertible into or exercisable or exchangeable for shares of our common stock, without the prior written consent of Stifel, Nicolaus & Company, Incorporated for a period of 90 days following the date of this prospectus (the “Lock-up Period”). This consent may be given at any time without public notice. These restrictions on future issuances are subject to exceptions for (i) the sale of common stock in this offering, (ii) the issuance of shares of our common stock upon the exercise of outstanding options or warrants and the vesting of restricted stock awards or units, (iii) the issuance of employee stock options not exercisable during the Lock-up Period and the grant, redemption or forfeiture of restricted stock awards or restricted stock units pursuant to our equity incentive plans or as new employee inducement grants and (iv) the issuance of common stock or warrants to purchase common stock in connection with mergers or acquisitions of securities, businesses, property or other assets, joint ventures, strategic alliances, equipment leasing arrangements or debt financing.
93
In addition, our directors and officers and the selling stockholders have entered into lock-up agreements with the underwriters. Under the lock-up agreements, the directors, officers and stockholders may not, directly or indirectly, sell, offer to sell, contract to sell, or grant any option for the sale (including any short sale), grant any security interest in, pledge, hypothecate, hedge, establish an open “put equivalent position” (within the meaning of Rule 16a-1(h) under the Exchange Act), or otherwise dispose of, or enter into any transaction which is designed to or could be expected to result in the disposition of, any shares of our common stock or securities convertible into or exchangeable for shares of our common stock, or publicly announce any intention to do any of the foregoing, without the prior written consent of Stifel, Nicolaus & Company, Incorporated, for the Lock-up Period. This consent may be given at any time without public notice. In addition, Stifel, Nicolaus & Company, Incorporated, in its sole discretion, may release the common stock and other securities subject to the lock-up agreements in whole or in part at any time. These restrictions on our directors and officers and the selling stockholders are subject to exceptions for (i) the sale of common stock in this offering, (ii) one or more bona fide gift transfers of securities to immediate family members who agree to be bound by these restrictions and (iii) transfers of securities to one or more trusts for bona fide estate planning purposes.
Market Information
Our common stock is listed on Nasdaq under the symbol “LOVE.”
Short Sales, Stabilizing Transactions and Penalty Bids
In order to facilitate this offering, persons participating in this offering may engage in transactions that stabilize, maintain or otherwise affect the price of the shares during and after this offering. Specifically, the underwriters may engage in the following activities in accordance with the rules of the SEC.
Short Sales
Short sales involve the sales by the underwriters of a greater number of shares of common stock than they are required to purchase in the offering. Covered short sales are short sales made in an amount not greater than the underwriters’ option to purchase additional shares of common stock. The underwriters may close out any covered short position by either exercising their option to purchase additional shares or purchasing shares in the open market. In determining the source of shares to close out the covered short position, the underwriters will consider, among other things, the price of our common stock available for purchase in the open market as compared to the price at which they may purchase the shares through their option.
Naked short sales are any short sales in excess of such option to purchase additional shares of common stock. The underwriters must close out any naked short position by purchasing shares of our common stock in the open market. A naked short position is more likely to be created if the underwriters are concerned that there may be downward pressure on the price of our common stock in the open market after pricing that could adversely affect investors who purchase in this offering.
Stabilizing Transactions
The underwriters may make bids for or purchases of shares of our common stock for the purpose of pegging, fixing or maintaining the price of our common stock, so long as stabilizing bids do not exceed a specified maximum.
94
Penalty Bids
If the underwriters purchase shares of our common stock in the open market in a stabilizing transaction or syndicate covering transaction, they may reclaim a selling concession from the underwriters and selling group members who sold those shares as part of this offering. Stabilization and syndicate covering transactions may cause the price of our common stock to be higher than it would be in the absence of these transactions. The imposition of a penalty bid might also have an effect on the price of the shares if it discourages resales of the shares.
The transactions above may occur on Nasdaq or otherwise. Neither we nor the underwriters make any representation or prediction as to the effect that the transactions described above may have on the price of our common stock. If such transactions are commenced, they may be discontinued without notice at any time.
Discretionary Sales
The underwriters have informed us that they do not expect to confirm sales of the shares of common stock offered by this prospectus to accounts over which they exercise discretionary authority without obtaining the specific approval of the account holder.
Electronic Distribution
A prospectus in electronic format may be made available on the Internet or through other online services maintained by one or more of the underwriters participating in this offering, or by their affiliates. Other than the prospectus in electronic format, the information on any underwriter’s website and any information contained in any other website maintained by an underwriter is not part of the prospectus or the registration statement of which this prospectus forms a part, has not been approved or endorsed by us or any underwriter in its capacity as underwriter and should not be relied upon by investors.
Relationships
The underwriters and their respective affiliates are full service financial institutions engaged in various activities, which may include securities trading, commercial and investment banking, financial advisory, investment management, principal investment, hedging, financing and brokerage activities. Certain of the underwriters and their affiliates have in the past provided, and may in the future from time to time provide, investment banking and other financing and banking services to us, for which they have in the past received, and may in the future receive, customary fees and reimbursement for their expenses. In the ordinary course of their various business activities, the underwriters and their respective affiliates may make or hold a broad array of investments and actively trade debt and equity securities (or related derivative securities) and financial instruments, including bank loans, for their own account and for the accounts of their customers and may at any time hold long and short positions in such securities and instruments. Such investment and securities activities may involve our securities and instruments.
95
Notice to Residents of the European Economic Area
In relation to each member state of the European Economic Area that has implemented the Prospectus Directive (each, a relevant member state), with effect from and including the date on which the Prospectus Directive is implemented in that relevant member state (the relevant implementation date), an offer of securities described in this prospectus may not be made to the public in that relevant member state other than:
| ● | to any legal entity which is a qualified investor as defined in the Prospectus Directive; |
| ● | to fewer than 100, or if the relevant member state has implemented the relevant provision of the 2010 PD Amending Directive (2010/73/EU) 150, natural or legal persons (other than qualified investors as defined in the Prospectus Directive), as permitted under the Prospectus Directive, subject to obtaining the prior consent of the representatives; or |
| ● | in any other circumstances that do not require the publication of a prospectus pursuant to Article 3 of the Prospectus Directive, |
provided that no such offer of securities shall require us or any underwriter to publish a prospectus pursuant to Article 3 of the Prospectus Directive. For purposes of this provision, the expression an “offer of securities to the public” in any relevant member state means the communication in any form and by any means of sufficient information on the terms of the offer and the securities to be offered so as to enable an investor to decide to purchase or subscribe the securities, as the expression may be varied in that member state by any measure implementing the Prospectus Directive in that member state, and the expression “Prospectus Directive” means Directive 2003/71/EC and includes any relevant implementing measure in each relevant member state.
We have not authorized and do not authorize the making of any offer of securities through any financial intermediary on their behalf, other than offers made by the underwriters with a view to the final placement of the securities as contemplated in this prospectus. Accordingly, no purchaser of the securities, other than the underwriters, is authorized to make any further offer of the securities on behalf of us or the underwriters.
Notice to Residents of the United Kingdom
This prospectus is only being distributed to, and is only directed at (i) persons who have professional experience in matters relating to investments falling within Article 19(5) of the Financial Services and Markets Act 2000 (Financial Promotion) Order 2005 as amended, or the Order, (ii) persons falling within Article 49(2)(a) to (d) (high net worth companies, unincorporated associations, etc.) of the Order; or (iii) persons to whom an invitation or inducement to engage in investment activity (within the meaning of section 21 of the Financial Services and Markets Act 2000) in connection with the issue or sale of any securities may otherwise lawfully be communicated or caused to be communicated (all such persons together being referred to as “relevant persons”). Any investment or investment activity to which this document relates is available only to relevant persons and will be engaged in only with relevant persons. Any person who is not a relevant person should not act or rely on this document or any of its contents.
Notice to Residents of Switzerland
The securities which are the subject of the offering contemplated by this prospectus may not be publicly offered in Switzerland and will not be listed on the SIX Swiss Exchange, or SIX, or on any other stock exchange or regulated trading facility in Switzerland. This prospectus has been prepared without regard to the disclosure standards for issuance prospectuses under art. 652a or art. 1156 of the Swiss Code of Obligations or the disclosure standards for listing prospectuses under art. 27 ff. of the SIX Listing Rules or the listing rules of any other stock exchange or regulated trading facility in Switzerland. None of this prospectus or any other offering or marketing material relating to the securities or the offering may be publicly distributed or otherwise made publicly available in Switzerland.
96
None of this prospectus or any other offering or marketing material relating to the offering, us or the securities have been or will be filed with or approved by any Swiss regulatory authority. In particular, this prospectus will not be filed with, and the offer of securities will not be supervised by the Swiss Financial Market Supervisory Authority, or FINMA, and the offer of securities has not been and will not be authorized under the Swiss Federal Act on Collective Investment Schemes, or CISA. The investor protection afforded to acquirers of interests in collective investment schemes under the CISA does not extend to acquirers of the securities.
Notice to Residents of Japan
The underwriters will not offer or sell any of the shares of common stock directly or indirectly in Japan or to, or for the benefit of, any Japanese person or to others, for reoffering or resale directly or indirectly in Japan or to any Japanese person, except in each case pursuant to an exemption from the registration requirements of, and otherwise in compliance with, the Financial Instruments and Exchange Law of Japan and any other applicable laws and regulations of Japan. For purposes of this paragraph, “Japanese person” means any person resident in Japan, including any corporation or other entity organized under the laws of Japan.
Notice to Residents of Hong Kong
The underwriters and each of their affiliates have not (i) offered or sold, and will not offer or sell, in Hong Kong, by means of any document, any shares of common stock other than (a) to “professional investors” within the meaning of the Securities and Futures Ordinance (Cap. 571) of Hong Kong and any rules made under that Ordinance or (b) in other circumstances which do not result in the document being a “prospectus” as defined in the Companies Ordinance (Cap. 32) of Hong Kong or which do not constitute an offer to the public within the meaning of that Ordinance; and (ii) issued or had in its possession for the purposes of issue, and will not issue or have in its possession for the purposes of issue, whether in Hong Kong or elsewhere any advertisement, invitation or document relating to the shares of common stock which is directed at, or the contents of which are likely to be accessed or read by, the public in Hong Kong (except if permitted to do so under the securities laws of Hong Kong) other than with respect to the shares of common stock which are or are intended to be disposed of only to persons outside Hong Kong or only to “professional investors” within the meaning of the Securities and Futures Ordinance and any rules made under that Ordinance. The contents of this document have not been reviewed by any regulatory authority in Hong Kong. You are advised to exercise caution in relation to the offer. If you are in any doubt about any of the contents of this document, you should obtain independent professional advice.
Notice to Residents of Singapore
This document has not been registered as a prospectus with the Monetary Authority of Singapore. Accordingly, this document and any other document or material in connection with the offer or sale, or invitation for subscription or purchase, of the shares of common stock may not be circulated or distributed, nor may the shares of common stock be offered or sold, or be made the subject of an invitation for subscription or purchase, whether directly or indirectly, to persons in Singapore other than (i) to an institutional investor under Section 274 of the Securities and Futures Act, Chapter 289 of Singapore (the Securities and Futures Act), (ii) to a relevant person, or any person pursuant to Section 275(1A), and in accordance with the conditions, specified in Section 275 of the Securities and Futures Act or (iii) otherwise pursuant to, and in accordance with the conditions of, any other applicable provision of the Securities and Futures Act.
Where the shares of common stock are subscribed or purchased under Section 275 by a relevant person, which is:
| (a) | a corporation (which is not an accredited investor) the sole business of which is to hold investments and the entire share capital of which is owned by one or more individuals, each of whom is an accredited investor; or | |
| (b) | a trust (where the trustee is not an accredited investor) whose sole purpose is to hold investments and each beneficiary is an accredited investor, shares, debentures and units of shares and debentures of that corporation or the beneficiaries’ rights and interest in that trust shall not be transferable for six months after that corporation or that trust has acquired the shares of common stock under Section 275 except: |
| (1) | to an institutional investor or to a relevant person, or to any person pursuant to an offer that is made on terms that such rights or interest are acquired at a consideration of not less than $200,000 (or its equivalent in a foreign currency) for each transaction, whether such amount is to be paid for in cash or by exchange of securities or other assets; |
| (2) | where no consideration is given for the transfer; or |
| (3) | by operation of law. |
97
Notice to Residents of Canada
This document constitutes an “exempt offering document” as defined in and for the purposes of applicable Canadian securities laws. No prospectus has been filed with any securities commission or similar regulatory authority in Canada in connection with the offer and sale of the shares. No securities commission or similar regulatory authority in Canada has reviewed or in any way passed upon this document or on the merits of the shares and any representation to the contrary is an offence.
Canadian investors are advised that this document has been prepared in reliance on section 3A.3 of National Instrument 33-105 Underwriting Conflicts (“NI 33-105”). Pursuant to section 3A.3 of NI 33-105, this document is exempt from the requirement that the company and the underwriters provide investors with certain conflicts of interest disclosure pertaining to “connected issuer” and/or “related issuer” relationships that may exist between the company and the underwriters as would otherwise be required pursuant to subsection 2.1(1) of NI 33-105.
Resale Restrictions
The offer and sale of the shares in Canada is being made on a private placement basis only and is exempt from the requirement that the company prepares and files a prospectus under applicable Canadian securities laws. Any resale of shares acquired by a Canadian investor in this offering must be made in accordance with applicable Canadian securities laws, which may vary depending on the relevant jurisdiction, and which may require resales to be made in accordance with Canadian prospectus requirements, a statutory exemption from the prospectus requirements, in a transaction exempt from the prospectus requirements or otherwise under a discretionary exemption from the prospectus requirements granted by the applicable local Canadian securities regulatory authority. These resale restrictions may under certain circumstances apply to resales of the shares outside of Canada.
Representations of Purchasers
Each Canadian investor who purchases the shares will be deemed to have represented to the company, the underwriters and to each dealer from whom a purchase confirmation is received, as applicable, that the investor (i) is purchasing as principal, or is deemed to be purchasing as principal in accordance with applicable Canadian securities laws, for investment only and not with a view to resale or redistribution; (ii) is an “accredited investor” as such term is defined in section 1.1 of National Instrument 45-106 Prospectus Exemptions (“NI 45-106”) or, in Ontario, as such term is defined in section 73.3(1) of the Securities Act (Ontario); and (iii) is a “permitted client” as such term is defined in section 1.1 of National Instrument 31-103 Registration Requirements, Exemptions and Ongoing Registrant Obligations.
Taxation and Eligibility for Investment
Any discussion of taxation and related matters contained in this document does not purport to be a comprehensive description of all of the tax considerations that may be relevant to a Canadian investor when deciding to purchase the shares and, in particular, does not address any Canadian tax considerations. No representation or warranty is hereby made as to the tax consequences to a resident, or deemed resident, of Canada of an investment in the shares or with respect to the eligibility of the shares for investment by such investor under relevant Canadian federal and provincial legislation and regulations.
98
Rights of Action for Damages or Rescission
Securities legislation in certain of the Canadian jurisdictions provides certain purchasers of securities pursuant to an offering memorandum, including where the distribution involves an “eligible foreign security” as such term is defined in Ontario Securities Commission Rule 45-501 Ontario Prospectus and Registration Exemptions and in Multilateral Instrument 45-107 Listing Representation and Statutory Rights of Action Disclosure Exemptions, as applicable, with a remedy for damages or rescission, or both, in addition to any other rights they may have at law, where the offering memorandum, or other offering document that constitutes an offering memorandum, and any amendment thereto, contains a “misrepresentation” as defined under applicable Canadian securities laws. These remedies, or notice with respect to these remedies, must be exercised or delivered, as the case may be, by the purchaser within the time limits prescribed under, and are subject to limitations and defenses under, applicable Canadian securities legislation. In addition, these remedies are in addition to and without derogation from any other right or remedy available at law to the investor.
Language of Documents
Upon receipt of this document, each Canadian investor hereby confirms that it has expressly requested that all documents evidencing or relating in any way to the sale of the securities described herein (including for greater certainty any purchase confirmation or any notice) be drawn up in the English language only. Par la réception de ce document, chaque investisseur canadien confirme par les présentes qu’il a expressément exigé que tous les documents faisant foi ou se rapportant de quelque manière que ce soit à la vente des valeurs mobilières décrites aux présentes (incluant, pour plus de certitude, toute confirmation d’achat ou tout avis) soient rédigés en anglais seulement.
Notice to Residents of United Arab Emirates
This prospectus is not intended to constitute an offer, sale or delivery of shares or other securities under the laws of the United Arab Emirates, or the UAE. The shares have not been and will not be registered under Federal Law No. 4 of 2000 Concerning the Emirates Securities and Commodities Authority and the Emirates Security and Commodity Exchange, or with the UAE Central Bank, the Dubai Financial Market, the Abu Dhabi Securities Market or with any other UAE exchange.
The offering, the shares and interests therein have not been approved or licensed by the UAE Central Bank or any other relevant licensing authorities in the UAE, and do not constitute a public offer of securities in the UAE in accordance with the Commercial Companies Law, Federal Law No. 8 of 1984 (as amended) or otherwise.
In relation to its use in the UAE, this prospectus is strictly private and confidential and is being distributed to a limited number of investors and must not be provided to any person other than the original recipient, and may not be reproduced or used for any other purpose. The interests in the shares may not be offered or sold directly or indirectly to the public in the UAE.
Notice to Residents of Australia
This document has not been lodged with the Australian Securities & Investments Commission and is only directed to certain categories of exempt persons. Accordingly, if you receive this document in Australia:
(a) you confirm and warrant that you are either:
| (i) | “sophisticated investor” under section 708(8)(a) or (b) of the Corporations Act 2001 (Cth) of Australia, or the Corporations Act; |
| (ii) | “sophisticated investor” under section 708(8)(c) or (d) of the Corporations Act and that you have provided an accountant’s certificate to the company which complies with the requirements of section 708(8)(c)(i) or (ii) of the Corporations Act and related regulations before the offer has been made; |
| (iii) | person associated with the company under section 708(12) of the Corporations Act; or |
| (iv) | “professional investor” within the meaning of section 708(11)(a) or (b) of the Corporations Act; |
99
and to the extent that you are unable to confirm or warrant that you are an exempt sophisticated investor, associated person or professional investor under the Corporations Act, any offer made to you under this document is void and incapable of acceptance; and
(b) you warrant and agree that you will not offer any of the shares issued to you pursuant to this document for resale in Australia within 12 months of those shares being issued unless any such resale offer is exempt from the requirement to issue a disclosure document under section 708 of the Corporations Act.
Notice to Residents of New Zealand
The shares offered hereby have not been offered or sold, and will not be offered or sold, directly or indirectly in New Zealand and no offering materials or advertisements have been or will be distributed in relation to any offer of shares in New Zealand, in each case other than:
| ● | to persons whose principal business is the investment of money or who, in the course of and for the purposes of their business, habitually invest money; |
| ● | to persons who in all the circumstances can properly be regarded as having been selected otherwise than as members of the public; |
| ● | to persons who are each required to pay a minimum subscription price of at least NZ$500,000 for the shares before the allotment of those shares (disregarding any amounts payable, or paid, out of money lent by the issuer or any associated person of the issuer); or |
| ● | in other circumstances where there is no contravention of the Securities Act 1978 of New Zealand (or any statutory modification or re-enactment of, or statutory substitution for, the Securities Act 1978 of New Zealand). |
100
The validity of the securities being offered by this prospectus has been passed upon for us by Duane Morris LLP, New York, New York. Certain legal matters in connection with this offering will be passed upon for the underwriters by DLA Piper LLP (US), New York, New York.
The financial statements as of and for the years ended February 3, 2019 and February 4, 2018, included in this prospectus and in the registration statement have been audited by Marcum LLP, an independent registered public accounting firm, to the extent and period as set forth in their report thereon dated May 3, 2019, appearing elsewhere herein and in the registration statement, in reliance upon such report given on the authority of said firm as experts in auditing and accounting.
No expert named in the registration statement of which this prospectus forms a part as having prepared or certified any part thereof (or named as having prepared or certified a report or valuation for use in connection with such registration statement) or counsel named in this prospectus as having given an opinion upon the validity of the securities being offered pursuant to this prospectus or upon other legal matters in connection with the registration or offering of such securities was employed for such purpose on a contingency basis. At the time of such preparation, certification or opinion or at any time thereafter, through the date of effectiveness of such registration statement or that part of such registration statement to which such preparation, certification or opinion relates, no such person had, or is to receive, in connection with the offering, a substantial interest, direct or indirect, in our Company or any of its parents or subsidiaries. Nor was any such person connected with our Company or any of its parents or subsidiaries as a promoter, managing or principal underwriter, voting trustee, director, officer or employee.
Where You Can Find More Information
We file annual, quarterly and current reports, proxy statements and other information with the Securities and Exchange Commission. Such filings are available to the public over the internet at the Securities and Exchange Commission’s website at http://www.sec.gov.
We have filed with the Securities and Exchange Commission a registration statement on Form S-1 under the Securities Act with respect to the securities offered under this prospectus. This prospectus, which forms a part of that registration statement, does not contain all information included in the registration statement. Certain information is omitted and you should refer to the registration statement and its exhibits.
You may review a copy of the registration statement at the Securities and Exchange Commission’s public reference room at 100 F Street, N.E. Washington, D.C. 20549 on official business days during the hours of 10 a.m. to 3 p.m. You may obtain information on the operation of the public reference room by calling the Securities and Exchange Commission at 1-800-SEC-0330. You may also read and copy any materials we file with the Securities and Exchange Commission at the Securities and Exchange Commission’s public reference room. Our filings and the registration statement can also be reviewed by accessing the Securities and Exchange Commission’s website at http://www.sec.gov.
101
Financial Statements
INDEX TO CONSOLIDATED FINANCIAL STATEMENTS
| Page Number | ||
| Audited Financial Statements for the Years Ended February 3, 2019 and February 4, 2018 | ||
| Report of Independent Registered Public Accounting Firm | F-3 | |
| Consolidated Balance Sheets | F-4 | |
| Consolidated Statements of Operations | F-5 | |
| Consolidated Statements of Changes in Stockholders’ Equity | F-6 | |
| Consolidated Statements of Cash Flows | F-7 | |
| Notes to Consolidated Financial Statements | F-8 |
F-1
THE LOVESAC COMPANY
CONTENTS
F-2
REPORT OF INDEPENDENT REGISTERED PUBLIC ACCOUNTING FIRM
To the Stockholders and Board of Directors of
The Lovesac Company
Opinion on the Financial Statements
We have audited the accompanying consolidated balance sheets of The Lovesac Company (the “Company”) as of February 3, 2019 and February 4, 2018, and the related consolidated statements of operations, changes in stockholders’ equity and cash flows for each of the two years in the period ended February 3, 2019, and the related notes (collectively referred to as the “financial statements”). In our opinion, the financial statements present fairly, in all material respects, the financial position of the Company as of February 3, 2019 and February 4, 2018, and the results of its operations and its cash flows for each of the two years in the period ended February 3, 2019, in conformity with accounting principles generally accepted in the United States of America.
Basis for Opinion
These financial statements are the responsibility of the Company's management. Our responsibility is to express an opinion on the Company's financial statements based on our audits. We are a public accounting firm registered with the Public Company Accounting Oversight Board (United States) ("PCAOB") and are required to be independent with respect to the Company in accordance with the U.S. federal securities laws and the applicable rules and regulations of the Securities and Exchange Commission and the PCAOB.
We conducted our audits in accordance with the standards of the PCAOB. Those standards require that we plan and perform the audits to obtain reasonable assurance about whether the financial statements are free of material misstatement, whether due to error or fraud. The Company is not required to have, nor were we engaged to perform, an audit of its internal control over financial reporting. As part of our audits we are required to obtain an understanding of internal control over financial reporting but not for the purpose of expressing an opinion on the effectiveness of the Company's internal control over financial reporting. Accordingly, we express no such opinion.
Our audits included performing procedures to assess the risks of material misstatement of the financial statements, whether due to error or fraud, and performing procedures that respond to those risks. Such procedures included examining, on a test basis, evidence regarding the amounts and disclosures in the financial statements. Our audits also included evaluating the accounting principles used and significant estimates made by management, as well as evaluating the overall presentation of the financial statements. We believe that our audits provide a reasonable basis for our opinion.
/s/ Marcum LLP
Marcum LLP
We have served as the Company’s auditor since 2017.
Hartford, CT
May 3, 2019
F-3
CONSOLIDATED BALANCE SHEETS
FEBRUARY 3, 2019 AND FEBRUARY 4, 2018
| 2019 | 2018 | |||||||
| Assets | ||||||||
| Current Assets | ||||||||
| Cash and cash equivalents | $ | 49,070,952 | $ | 9,175,951 | ||||
| Trade accounts receivable | 3,955,124 | 2,805,186 | ||||||
| Merchandise inventories | 26,154,314 | 11,641,482 | ||||||
| Prepaid expenses and other current assets | 5,933,872 | 6,062,946 | ||||||
| Total Current Assets | 85,114,262 | 29,685,565 | ||||||
| Property and Equipment, Net | 18,595,079 | 11,037,289 | ||||||
| Other Assets | ||||||||
| Goodwill | 143,562 | 143,562 | ||||||
| Intangible assets, net | 942,331 | 526,370 | ||||||
| Deferred financing costs, net | 219,071 | 48,149 | ||||||
| Total Other Assets | 1,304,964 | 718,081 | ||||||
| Total Assets | $ | 105,014,305 | $ | 41,440,935 | ||||
| Liabilities and Stockholders’ Equity | ||||||||
| Current Liabilities | ||||||||
| Accounts payable | $ | 16,836,816 | $ | 12,695,954 | ||||
| Accrued expense | 3,701,090 | 784,340 | ||||||
| Payroll payable | 2,269,834 | 1,454,193 | ||||||
| Customer deposits | 1,059,957 | 909,236 | ||||||
| Sales taxes payable | 750,922 | 894,882 | ||||||
| Line of credit | - | 405 | ||||||
| Total Current Liabilities | 24,618,619 | 16,739,010 | ||||||
| Deferred rent | 1,594,179 | 1,063,472 | ||||||
| Line of credit | 31,373 | - | ||||||
| Total Liabilities | 26,244,171 | 17,802,482 | ||||||
| Commitments and contingencies (see Note 6) | ||||||||
| Stockholders’ Equity | ||||||||
| Preferred Stock $.00001 par value, 10,000,000 shares authorized, no shares issued and outstanding as of February 3, 2019 and 1,018,600, shares issued and outstanding as of February 4, 2018. | - | 10 | ||||||
| Common Stock $.00001 par value, 40,000,000 shares authorized, 13,588,568 shares issued and outstanding as of February 3, 2019 and 6,064,500 shares issued and outstanding as of February 4, 2018, respectively. | 136 | 61 | ||||||
| Additional paid-in capital | 141,727,807 | 79,891,835 | ||||||
| Accumulated deficit | (62,957,809 | ) | (56,253,453 | ) | ||||
| Stockholders’ Equity | 78,770,134 | 23,638,453 | ||||||
| Total Liabilities and Stockholders’ Equity | $ | 105,014,305 | $ | 41,440,935 | ||||
The accompanying notes are an integral part of these consolidated financial statements
F-4
CONSOLIDATED STATEMENTS OF OPERATIONS
FEBRUARY 3, 2019 AND FEBRUARY 4, 2018
| 2019 | 2018 | |||||||
| Net sales | $ | 165,881,297 | 101,810,413 | |||||
| Cost of merchandise sold | 75,000,476 | 44,593,261 | ||||||
| Gross profit | 90,880,821 | 57,217,152 | ||||||
| Operating expenses | ||||||||
| Selling, general and administration expenses | 76,426,892 | 50,848,128 | ||||||
| Advertising and marketing | 18,363,491 | 9,192,358 | ||||||
| Depreciation and amortization | 3,133,751 | 2,214,499 | ||||||
| Total operating expenses | 97,924,134 | 62,254,985 | ||||||
| Operating loss | (7,043,313 | ) | (5,037,833 | ) | ||||
| Interest income (expense), net | 355,364 | (437,965 | ) | |||||
| Net loss before taxes | (6,687,949 | ) | (5,475,798 | ) | ||||
| Provision for income taxes | (16,407 | ) | (26,000 | ) | ||||
| Net loss | $ | (6,704,356 | ) | $ | (5,501,798 | ) | ||
| Net loss per common share: | ||||||||
| Basic and diluted | $ | (3.28 | ) | $ | (1.12 | ) | ||
| Weighted average number of common shares outstanding: | ||||||||
| Basic and diluted | 10,536,721 | 6,000,699 | ||||||
The accompanying notes are an integral part of these consolidated financial statements
F-5
CONSOLIDATED STATEMENTS OF CHANGES IN STOCKHOLDERS’ EQUITY
FEBRUARY 3, 2019 AND FEBRUARY 4, 2018
| Common | Preferred | Additional Paid-in | Accumulated | |||||||||||||||||||||||||
| Shares | Amount | Shares | Amount | Capital | Deficit | Total | ||||||||||||||||||||||
| Balance - January 29, 2017 | 6,000,000 | $ | 60 | 120,000 | $ | 1 | $ | 57,801,447 | $ | (50,751,655 | ) | $ | 7,049,853 | |||||||||||||||
| Net loss | - | - | - | - | - | (5,501,798 | ) | (5,501,798 | ) | |||||||||||||||||||
| Equity based compensation | - | - | - | - | 950,554 | - | 950,554 | |||||||||||||||||||||
| Vested restricted stock units | 64,500 | 1 | - | - | (1 | ) | - | - | ||||||||||||||||||||
| Issuance of preferred stock, net of issuance costs | - | - | 898,600 | 9 | 21,139,835 | - | 21,139,844 | |||||||||||||||||||||
| Balance – February 4, 2018 | 6,064,500 | $ | 61 | 1,018,600 | $ | 10 | $ | 79,891,835 | $ | (56,253,453 | ) | $ | 23,638,453 | |||||||||||||||
| Net loss | - | - | - | - | - | (6,704,356 | ) | (6,704,356 | ) | |||||||||||||||||||
| Equity based compensation | - | - | - | - | 2,568,518 | - | 2,568,518 | |||||||||||||||||||||
| Issuance of common stock for services | 50,000 | - | - | - | 741,500 | - | 741,500 | |||||||||||||||||||||
| Vested restricted stock units | 125,633 | 2 | - | - | (382,535 | ) | - | (382,533 | ) | |||||||||||||||||||
| Exercise of warrants | 35,994 | - | - | - | - | - | - | |||||||||||||||||||||
| Preferred stock conversion | 3,287,441 | 33 | (1,018,600 | ) | (10 | ) | (23 | ) | - | - | ||||||||||||||||||
| Initial public offering, net of issuance costs | 4,025,000 | 40 | - | - | 58,908,512 | - | 58,908,552 | |||||||||||||||||||||
| Balance – February 3, 2019 | 13,588,568 | $ | 136 | - | $ | - | $ | 141,727,807 | $ | (62,957,809 | ) | $ | 78,770,134 | |||||||||||||||
The accompanying notes are an integral part of these consolidated financial statements
F-6
CONSOLIDATED STATEMENTS OF CASH FLOWS
FEBRUARY 3, 2019 AND FEBRUARY 4, 2018
| 2019 | 2018 | |||||||
| Cash Flows from Operating Activities | ||||||||
| Net loss | $ | (6,704,356 | ) | $ | (5,501,798 | ) | ||
| Adjustments to reconcile net loss to net cash used in operating activities: | ||||||||
| Depreciation and amortization of property and equipment | 2,935,202 | 1,996,191 | ||||||
| Amortization of other intangible assets | 198,549 | 218,308 | ||||||
| Amortization of deferred financing fees | 121,173 | 144,505 | ||||||
| Loss on disposal of property and equipment | 254,720 | 196,540 | ||||||
| Equity based compensation | 3,310,018 | 950,554 | ||||||
| Deferred rent | 530,707 | 359,829 | ||||||
| Changes in operating assets and liabilities: | ||||||||
| Accounts receivable | (1,149,938 | ) | (1,796,671 | ) | ||||
| Merchandise inventories | (14,512,832 | ) | (2,208,463 | ) | ||||
| Prepaid expenses and other current assets | 129,074 | (4,164,720 | ) | |||||
| Accounts payable and accrued expenses | 7,729,293 | 6,851,550 | ||||||
| Customer deposits | 150,721 | 213,838 | ||||||
| Net Cash Used in Operating Activities | $ | (7,007,669 | ) | $ | (2,740,337 | ) | ||
| Cash Flows from Investing Activities | ||||||||
| Purchase of property and equipment | (10,747,712 | ) | (6,636,489 | ) | ||||
| Payments for patents and trademarks | (614,510 | ) | (172,861 | ) | ||||
| Net Cash Used in Investing Activities | (11,362,222 | ) | (6,809,350 | ) | ||||
| Cash Flows from Financing Activities | ||||||||
| Proceeds from initial public offering, net of issuance costs | 58,908,552 | - | ||||||
| Taxes paid for net share settlement of equity awards | (382,533 | ) | - | |||||
| Proceeds from the sale of preferred stock net of issuance costs | - | 21,139,845 | ||||||
| Principal payments on note payable | - | (194,530 | ) | |||||
| Proceeds from (paydowns of) line of credit | 30,968 | (3,098,372 | ) | |||||
| Payments of deferred financing costs | (292,095 | ) | - | |||||
| Net Cash Provided by Financing Activities | 58,264,892 | 17,846,943 | ||||||
| Net Change in Cash and Cash Equivalents | 39,895,001 | 8,297,256 | ||||||
| Cash and Cash Equivalents - Beginning | 9,175,951 | 878,696 | ||||||
| Cash and Cash Equivalents - End | $ | 49,070,952 | 9,175,951 | |||||
| Supplemental Cash Flow Disclosures | ||||||||
| Cash paid for taxes | $ | 18,246 | $ | 25,771 | ||||
| Cash paid for interest | $ | 61,436 | $ | 173,447 | ||||
The accompanying notes are an integral part of these consolidated financial statements
F-7
CONSOLIDATED NOTES TO FINANCIAL STATEMENTS
FEBRUARY 3, 2019 AND FEBRUARY 4, 2018
Note 1 – Operations and Significant Accounting Policies
Nature of Operations and Liquidity
The Lovesac Company (the “Company”), a Delaware corporation was formed on January 3, 2017, in connection with a corporate reorganization with SAC Acquisition LLC, a Delaware limited liability company, the predecessor entity to the Company and currently the largest stockholder of the Company. Pursuant to the terms of the reorganization, which was completed on March 22, 2017, SAC Acquisition LLC assigned, and the Company assumed all rights, title and interest to, all assets and liabilities of SAC Acquisition LLC, including the intellectual property that is currently owned by the Company, in exchange for 6,000,000 shares of common stock of the Company.
The Company designs and sells foam filled furniture, sectional couches, and related accessories throughout the world. As of February 3, 2019, the Company operated 75 leased retail showrooms located throughout the United States. In addition, the Company operates a retail internet website and does business to business transactions through its wholesale operations.
The Company has incurred significant operating losses and used cash in its operating activities since inception. Operating losses have resulted from inadequate sales levels for the cost structure and expenses as a result of expanding into new markets, opening new showrooms, and investments into marketing and infrastructure to support increases in revenues. The Company continues to enter into new retail showrooms in larger markets to increase sales levels and invest in marketing initiatives to increase brand awareness. Of course, there can be no assurance that the anticipated sales levels will be achieved.
On June 22, 2018, the board of directors of the Company approved a 1-for-2.5 reverse stock split of the Company’s shares of common stock. The reverse stock split became effective immediately prior to the closing of its initial public offering (“IPO”). All stock amounts included in these financial statements have been adjusted to reflect this reverse stock split.
On June 27, 2018, the Company completed its IPO, selling 4,025,000 shares of common stock at a price of $16.00 per share. Net proceeds to the Company from the offering was approximately $58.9 million after legal and underwriting expenses. The Company believes that based on its current sales and expense levels, projections for the next twelve months, the credit facility with Wells Fargo Bank (see Note 9), and the proceeds from the IPO, the Company will have sufficient working capital to cover operating cash needs through the twelve month period from the financial statement issuance date.
On October 29, 2018, certain selling stockholders conducted a secondary offering of 2,220,000 shares of common stock of the Company. The Company did not sell any shares or receive any proceeds from the sale of the common stock by the selling stockholders.
Immediately prior to the secondary offering, SAC Acquisition LLC and its affiliated entities owned approximately 56% of the Company’s common stock. Immediately after the completion of the secondary offering, such entities owned approximately 44% of the Company’s common stock. Accordingly, the Company ceased to be a “controlled company” within the meaning of the corporate governance standards of Nasdaq and the Company will, subject to certain transition periods permitted by Nasdaq rules, no longer rely on exemptions from corporate governance requirements that are available to controlled companies.
F-8
THE LOVESAC COMPANY
CONSOLIDATED NOTES TO FINANCIAL STATEMENTS
FEBRUARY 3, 2019 AND FEBRUARY 4, 2018
Note 1 – Operations and Significant Accounting Policies (Continued)
Significant Accounting Policies
Principles of Consolidation
The consolidated financial statements include the accounts of the Company and its subsidiary. All significant intercompany accounts and transactions have been eliminated in consolidation.
Fiscal Year
The Company’s fiscal year is determined on a 52/53 week basis ending on the Sunday closest to February 1st. Hereinafter, the periods from February 5, 2018 through February 3, 2019 and January 30, 2017 through February 4, 2018 are referred to as fiscal 2019 and 2018, respectively. Fiscal 2019 was a 52 week fiscal year and fiscal 2018 was a 53 week fiscal year.
Use of Estimates
The preparation of financial statements in conformity with accounting principles generally accepted in the United States of America (“US GAAP”) requires management to make estimates and assumptions that affect the reported amounts of assets and liabilities and disclosure of contingent assets and liabilities at the date of the financial statements and the reported amounts of revenues and expenses during the reporting period. Actual results could differ from those estimates. Estimates and assumptions are reviewed periodically and the effects of the revisions are reflected in the period the change is determined.
Reclassification
Certain prior period amounts have been reclassified to conform to current year presentation. The reclassification has no effect on the previously reported net loss.
Revenue Recognition
Company revenues consist of sales made to consumers at Company operated showrooms and via the internet and also sales made business to business. Sales made at Company operated showrooms are recognized at the point of sale when payment is tendered and ownership is transferred to the customer. Sales of merchandise via the internet are recognized upon receipt and verification of payment and shipment of the merchandise to the customer. Ownership and risk of loss transfer to the customer upon shipment. Sales made to businesses are recognized at the point of shipment when ownership and the risk of loss transfer to the customer. Customer deposits are recorded for sales made for which ownership has not transferred as a result of payment received for goods upon order but not yet shipped at the end of any fiscal accounting period. These deposits are carried on the Company’s balance sheet until delivery is fulfilled which is typically within 3-4 days of an order being processed.
Recorded net sales provide for estimated returns and allowances. The Company permits its customers to return products up 60 days after purchase, along with defective products and incorrect shipments.
The Company has no foreign operations and its sales to foreign countries was less than 0.05% of total net sales in both fiscal 2019 and 2018.
The Company had no customer in fiscal 2019 or 2018 that comprise more than 10% of total net sales.
Revenue is recognized net of sales tax collected.
F-9
THE LOVESAC COMPANY
CONSOLIDATED NOTES TO FINANCIAL STATEMENTS
FEBRUARY 3, 2019 AND FEBRUARY 4, 2018
Note 1 – Operations and Significant Accounting Policies (Continued)
Cash and Cash Equivalents
The Company considers all highly liquid investments with a maturity at purchase of three months or less to be cash equivalents.
The Company has deposits with financial institutions that maintain Federal Deposit Insurance Corporation “FDIC” deposit insurance up to $250,000 per depositor. The portion of the deposit in excess of this limit represents a credit risk to the Company. At times the Company maintains depository balances in excess of the insured amounts.
Trade Accounts Receivable
Trade accounts receivable are carried at their estimated realizable amount and do not bear interest. Management determines the allowance for doubtful accounts by regularly evaluating individual customer accounts, considering the customer’s financial condition, and credit history, and general and industry current economic conditions. Trade accounts receivable are reserved for when deemed uncollectible. Recoveries of amounts previously written off are recorded when received. Historically, collection losses have been immaterial as a significant portion of the Company’s receivables are related to individual credit card transactions. Management has concluded that an allowance was not necessary at February 3, 2019 and February 4, 2018.
Breakdown of accounts receivable is as follows:
| As of February 3, 2019 | As of February 4, 2018 | |||||||
| Credit card receivables | $ | 838,373 | $ | 1,230,171 | ||||
| Wholesale receivables | 2,850,000 | 974,291 | ||||||
| Other receivables | 266,751 | 600,724 | ||||||
| $ | 3,955,124 | $ | 2,805,186 | |||||
The Company has one wholesale customer that comprised approximately 100% and 68% of wholesale receivables at February 3, 2019 and February 4, 2018, respectively.
Prepaid Expenses and other Current Assets
The Company recognizes payments made for goods and services to be received in the near future as prepaid expenses and other current assets. Prepaid expenses and other current assets consist primarily of payments related to insurance premiums, catalogue costs, deposits and other costs.
F-10
THE LOVESAC COMPANY
CONSOLIDATED NOTES TO FINANCIAL STATEMENTS
FEBRUARY 3, 2019 AND FEBRUARY 4, 2018
Note 1 – Operations and Significant Accounting Policies (Continued)
Merchandise Inventories
Merchandise inventories are comprised of finished goods and are carried at the lower of cost or net realizable value. Cost is determined on a weighted-average basis. Merchandise inventories consist primarily of foam filled furniture, sectional couches and related accessories. The Company adjusts its inventory for obsolescence based on historical trends, aging reports, specific identification and its estimates of future retail sales prices.
Gift Certificates and Merchandise Credits
The Company sells gift certificates and issues merchandise credits to its customers in the showrooms and through its website. Revenue associated with gift certificates and merchandise credits is deferred until redemption of the gift certificate and merchandise credits. The Company did not recognize any breakage revenue in fiscal 2019 or fiscal 2018 as the Company continues to honor all outstanding gift certificates.
Property and Equipment, net
Property and equipment are stated at cost less accumulated depreciation and amortization. Office and showroom furniture and equipment, software and vehicles are depreciated using the straight-line method over their estimated useful lives. Leasehold improvements are amortized using the straight-line method over their expected useful lives or lease term, whichever is shorter.
Expenditures for repairs and maintenance are charged to expense as incurred. For assets sold or otherwise disposed of, the cost and related accumulated depreciation or amortization is removed from the accounts, and any resulting gain or loss is reflected in operations for the period. Expenditures for major betterments that extend the useful lives of property and equipment are capitalized.
Goodwill
Goodwill represents the excess of the purchase price over the fair value of the identified net assets of each business acquired. Goodwill and other indefinite-lived intangible assets are tested annually for impairment in the fourth fiscal quarter and in interim periods if certain events occur indicating that the carrying amounts may be impaired. If a qualitative assessment is used and the Company determines that the fair value of a reporting unit or indefinite-lived intangible asset is more likely than not (i.e., a likelihood of more than 50%) less than its carrying amount, a quantitative impairment test will be performed. If goodwill is quantitatively assessed for impairment, a two-step approach is applied.
F-11
THE LOVESAC COMPANY
CONSOLIDATED NOTES TO FINANCIAL STATEMENTS
FEBRUARY 3, 2019 AND FEBRUARY 4, 2018
Note 1 – Operations and Significant Accounting Policies (Continued)
Goodwill (Continued)
In the first step, the Company compares the fair value of the reporting unit, generally defined as the same level as or one level below an operating segment, to its carrying value. If the fair value of the reporting unit exceeds the carrying value of the net assets assigned to that unit, goodwill is considered not impaired and the Company is not required to perform further testing. If the carrying value of the net assets assigned to the reporting unit exceeds the fair value of the reporting unit, then the second step of the impairment test must be performed in order to determine the implied fair value of the reporting unit’s goodwill. If the carrying value of a reporting unit’s goodwill exceeds its implied fair value, then an impairment loss equal to the difference would be recorded.
There were no impairments during either fiscal 2019 or 2018.
The fair value of the Company’s reporting unit is determined by using a discounted cash flow analysis. The determination of fair value requires assumptions and estimates of many critical factors, including among others, the nature and history of the Company, financial and economic conditions affecting the Company, the industry and the general economy, past results, current operations and future prospects, sales of similar businesses or capital stock of publicly held similar businesses, as well as prices, terms and conditions affecting past sales of similar businesses. Forecasts of future operations are based, in part, on operating results and management’s expectations as to future market conditions. These types of analyses contain uncertainties because they require management to make assumptions and to apply judgments to estimate industry economic factors and the profitability of future business strategies. However, if actual results are not consistent with the Company’s estimates and assumptions, there may be exposure to future impairment losses that could be material.
Patents and Licenses
Patents and licenses are recorded at cost and amortized on a straight-line basis over the estimated remaining life of the patent or license. Ongoing maintenance costs are expensed as incurred.
Intangible Assets
Intangible assets with finite useful lives, including a vendor relationship, and patents and trade names, are being amortized on a straight-line basis over their estimated lives. Other intangible assets with finite useful lives are reviewed for impairment whenever events or circumstances indicate that the carrying amount of the asset might not be recovered.
If the estimates of the useful lives should change, the Company will amortize the remaining book value over the remaining useful life, or it is deemed to be impaired a write-down of the value of the asset may be required at such time.
There were no impairments during either fiscal 2019 or 2018.
F-12
THE LOVESAC COMPANY
CONSOLIDATED NOTES TO FINANCIAL STATEMENTS
FEBRUARY 3, 2019 AND FEBRUARY 4, 2018
Note 1 – Operations and Significant Accounting Policies (Continued)
Deferred Financing Costs
The Company’s financing costs are capitalized and amortized over the life of the related financing. The financing costs are treated as debt discounts with the exception of revolving lines of credit. Previously acquired debt discounts were amortized over the life of the loans as interest expense. The debt discounts were fully amortized in fiscal 2019. In fiscal 2019, the Company paid $292, 095 in connection with the renegotiated terms of its line of credit. The Company amortized to interest expense $121,173 in fiscal 2019 and $144,505 in fiscal 2018 of financing costs.
Impairment of Long-Lived Assets
The Company’s long-lived assets consist of property and equipment, which includes leasehold improvements, and other intangible assets. Long-lived assets are reviewed for potential impairment at such time that events or changes in circumstances indicate that the carrying amount of an asset might not be recovered. The Company evaluates property and equipment for impairment at the individual showroom level, which is the lowest level at which individual cash flows can be identified. When evaluating long-lived assets for potential impairment, the Company will first compare the carrying amount of the assets to the future undiscounted cash flows for the respective long-lived asset. If the estimated future cash flows are less than the carrying amounts of the assets, an impairment loss calculation is prepared. An impairment loss is measured based upon the excess of the carrying value of the asset over its estimated fair value which is generally based on an estimated future discounted cash flow. If required, an impairment loss is recorded for that portion of the asset’s carrying value in excess of fair value.
There were no impairments of long-lived assets during fiscal 2019 or 2018.
Advertising and Catalog Costs
The Company capitalizes direct response advertising costs, which consist primarily of television advertising, postcards, catalogues and their mailing costs, and recognizes expense over the related revenue stream if the following conditions are met (1) the primary purpose of the advertising is to elicit sales to customers who could be shown to have responded specifically to the advertising, and (2) the direct-response advertising results in probable and estimable future benefits.
For the years ended February 3, 2019 and February 4, 2018 the Company capitalized deferred direct-response television, postcard and catalogue costs of approximately $0 and $3,060,029, respectively. The net balance remaining at February 3, 2019 and February 4, 2018, after amortization, was $0 and $1,348,908, respectively.
F-13
THE LOVESAC COMPANY
CONSOLIDATED NOTES TO FINANCIAL STATEMENTS
FEBRUARY 3, 2019 AND FEBRUARY 4, 2018
Note 1 – Operations and Significant Accounting Policies (Continued)
Advertising and Catalog Costs (continued)
Direct-response advertising costs, which are included in prepaid expenses and other current assets, are amortized commencing the date the catalogs and post cards are mailed and the television commercial airs through the estimated period of time for the Company has determined the related advertising impacts sales. The entire outstanding balance as of February 4, 2018 was fully amortized in fiscal 2019. There was no balance as of February 3, 2019.
Advertising costs not associated with direct-response advertising are expensed as incurred. Advertising expenses (including amortization of direct-response advertising) which are included in selling, general and administrative expenses were $16,727,070 in fiscal 2019 and $6,213,603 in fiscal 2018.
Showroom preopening and closing Costs
Non-capital expenditures incurred in preparation for opening new retail showrooms are expensed as incurred and included in selling, general and administrative expenses.
The Company continually evaluates the profitability of its showrooms. When the Company closes or relocates a showroom, the Company incurs unrecoverable costs, including the net book value of abandoned fixtures and leasehold improvements, lease termination payments, costs to transfer inventory and usable fixtures and other costs of vacating the leased location. Such costs are expensed as incurred and are included in selling, general and administrative expenses.
Product Warranty
Depending on the type of merchandise, the Company offers either a three year limited warranty or a lifetime warranty. The Company’s warranties require it to repair or replace defective products at no cost to the customer. At the time product revenue is recognized, the Company reserves for estimated future costs that may be incurred under its warranties based on historical experience. The Company periodically reviews the adequacy of its recorded warranty liability. Product warranty expense was approximately $414,000 in fiscal 2019 and $423,000 in fiscal 2018.
F-14
THE LOVESAC COMPANY
CONSOLIDATED NOTES TO FINANCIAL STATEMENTS
FEBRUARY 3, 2019 AND FEBRUARY 4, 2018
Note 1 – Operations and Significant Accounting Policies (Continued)
Operating leases
Minimum operating lease expenses are recognized on a straight-line basis over the terms of the leases.
The Company’s operating leases contain provisions for certain incentives. Incentives are deferred and are amortized over the underlying lease term on a straight-line basis as a reduction to rent expense. When the terms or the Company’s leases provide for free rent, concessions and/or escalations, the Company establishes a deferred rent liability or asset for the difference of the scheduled rent payments and a straight line rent expense. This liability or asset increases or decreases depending on where the Company is at any given time in the life of the lease. Percentage rent is not subject to straight-line expensing and is expensed as incurred.
Fair Value Measurements
The carrying amount of the Company’s financial instruments classified as current assets and current liabilities approximate fair values based on the short term nature of the accounts.
Equity Based Compensation
The Company’s 2017 Equity Incentive Plan provides for awards in the form of options, stock appreciation rights, restricted stock awards, restricted stock, performance shares, cash-based awards and other stock-based awards. The plan allows for the issuance of up to 615,066 shares at February 3, 2019 and 1,050,000 at February 4, 2018. All awards shall be granted within 10 years from the effective date of the plan. The restricted stock units vest based in part on time and in part on the achievement of certain performance criteria. See Note 7 for additional disclosure.
Shipping and Handling
Shipping and handling charges billed to customers are included in revenue. Shipping and handling costs incurred are included in cost of merchandise sold. Shipping and handling costs were $25,132,736 in fiscal 2019 and $12,739,891 in fiscal 2018.
F-15
THE LOVESAC COMPANY
CONSOLIDATED NOTES TO FINANCIAL STATEMENTS
FEBRUARY 3, 2019 and FEBRUARY 4, 2018
Note 1 – Operations and Significant Accounting Policies (Continued)
Income Taxes
The Company accounts for uncertainty in income taxes using a two-step approach to recognizing and measuring uncertain tax positions. The first step is to evaluate the tax position for recognition by determining if the weight of available evidence indicates that it is more likely than not that the position will be sustained on audit, including resolution of related appeals or litigation processes, if any. The second step is to measure the tax benefit as the largest amount that is more than 50% likely of being realized upon settlement. The Company classifies the liability for unrecognized tax benefits as current to the extent that the Company anticipates payment (or receipt) of cash within one year. Interest and penalties related to uncertain tax positions are recognized in the provision for income taxes.
In connection with the 2017 reorganization, the intent was that the net operating losses (“NOLs”) of SAC Acquisition LLC (“SAC”), a limited liability company that had been historically treated as a C-corporation for federal and state income tax purposes, were to be inherited by the Company. The Company is currently working with the IRS with respect to the 2017 reorganization, the resolution of which could affect the amount and nature of its NOLs. Notwithstanding the above, the Company has maintained the position that the NOLs were inherited from SAC in the 2017 reorganization and consistently maintained a full valuation allowance against its NOLs, as they were part of deferred income tax assets not likely to be realized. Accordingly, the resolution of the uncertain tax position regarding the Company’s NOL carryforward will have no impact on the Company’s financial position or results of operations. As of February 3, 2019, there are NOLs of approximately $10.8 million identified as an uncertain tax position. As of February 4, 2018, there were no uncertain tax positions. See Note 5 for additional disclosures.
Deferred income taxes are provided on temporary differences between the income tax bases of assets and liabilities and the amounts reported in the financial statements and on net operating loss and tax credit carry forwards.
A valuation allowance is provided for that portion of deferred income tax assets not likely to be realized. Deferred income tax assets and liabilities are adjusted for the effects of changes in tax laws and rates on the date of enactment.
Basic and Diluted Net Loss Per Share
Basic net loss per common share is computed by dividing net loss by the weighted average number of common shares outstanding during the period. As a result of the Company’s net loss for both years presented, potentially dilutive securities were excluded from the computation of diluted loss per share, as their effect would be anti-dilutive. Potentially dilutive securities include unvested restricted stock units in the amounts of 377,286 and 193,500 for fiscals 2019 and 2018, respectively and common stock warrants outstanding of 1,067,475 and 930,054 for fiscals 2019 and 2018, respectively.
F-16
THE LOVESAC COMPANY
CONSOLIDATED NOTES TO FINANCIAL STATEMENTS
FEBRUARY 3, 2019 AND FEBRUARY 4, 2018
Note 1 – Operations and Significant Accounting Policies (Continued)
Basic and Diluted Net Loss Per Share (continued)
Basic and diluted net loss per common share is computed as follows:
| For the year ended February 3, 2019 | For the year ended February 4, 2018 | |||||||
| Numerator: | ||||||||
| Net loss - Basic and diluted | $ | (6,704,356 | ) | $ | (5,501,798 | ) | ||
| Preferred dividends and deemed dividends | (27,832,998 | ) | (1,208,003 | ) | ||||
| Net loss attributable to common shares | (34,537,354 | ) | (6,709,801 | ) | ||||
| Denominator: | ||||||||
| Weighted average number of common shares for basic and diluted net loss per share | 10,536,721 | 6,000,699 | ||||||
| Basic and diluted net loss per share | $ | (3.28 | ) | $ | (1.12 | ) | ||
New Accounting Pronouncements
Except as described below, the Company has considered all other recently issued accounting pronouncements and does not believe the adoption of such pronouncements will have a material impact on its financial statements. The Company, as an emerging growth company, has elected to use the extended transition period for complying with new or revised financial accounting standards.
In August 2015, the Financial Accounting Standards Board (“FASB”) issued Accounting Standard Update (“ASU”) No. 2015-14, which defers the effective date of ASU No. 2014-09, Revenue from Contracts with Customers (Topic 606) by one year. ASU 2014-09 is a comprehensive new revenue recognition model requiring a company to recognize revenue to depict the transfer of goods or services to a customer at an amount reflecting the consideration it expects to receive in exchange for those goods or services. As a result, ASU 2015-14 is now effective for fiscal years, and interim periods within those years, beginning after December 15, 2018, which for the Company is fiscal 2020. Earlier application is permitted. The Company will adopt the guidance beginning in the first quarter of fiscal 2020 using the modified retrospective method. The Company has evaluated and continues to evaluate the impact of the adoption of the new revenue recognition standard. The adoption of this standard will not have a material impact on the Company’s financial position and results of operations other than the need for increased disclosure.
In February 2016, FASB issued ASU No. 2016-02, Leases (Topic 842) amending lease guidance to increase transparency and comparability among organizations by recognizing lease assets and lease liabilities on the balance sheet and disclosing key information about leasing arrangements. ASU No. 2016-02 is effective for fiscal years beginning after December 15, 2019, and interim periods within fiscal years beginning after December 15, 2020, with early adoption permitted. Management is currently evaluating the impact ASU No. 2016-02 will have on these consolidated financial statements.
In August 2016, FASB issued ASU 2016-15, Statement of Cash Flows: Clarification of Certain Cash Receipts and Cash Payments, which eliminates the diversity in practice related to classification of certain cash receipts and payments in the statement of cash flows, by adding or clarifying guidance on eight specific cash flow issues. ASU 2016-15 is effective for fiscal years beginning after December 15, 2018, and interim periods within fiscal years beginning after December 15, 2019, which for the Company is fiscal 2020. Early adoption is permitted, including adoption in an interim period. The Company has not yet determined the effect of the adoption of ASU 2016-15 on the Company’s consolidated financial position and results of operations.
F-17
THE LOVESAC COMPANY
CONSOLIDATED NOTES TO FINANCIAL STATEMENTS
FEBRUARY 3, 2019 AND FEBRUARY 4, 2018
Note 2 – Property and Equipment, Net
Property and equipment as of February 3, 2019 and February 4, 2018 consists of:
| Estimated Life | 2019 | 2018 | ||||||||
| Office and store furniture, and equipment | 5 Years | $ | 4,798,414 | $ | 3,430,735 | |||||
| Software | 3 Years | 2,707,666 | 2,429,149 | |||||||
| Leasehold improvements | Shorter
of estimated useful life or lease term |
20,088,812 | 13,859,312 | |||||||
| Construction in process | NA | 2,222,218 | 638,373 | |||||||
| 29,817,110 | 20,357,569 | |||||||||
| Accumulated depreciation and amortization | (11,222,031 | ) | (9,320,280 | ) | ||||||
| $ | 18,595,079 | $ | 11,037,289 | |||||||
Depreciation expense was $2,935,202 in fiscal 2019 and $1,996,191 in fiscal 2018.
Note 3 – Other Intangible Assets, Net
A summary of other intangible assets follows:
| February 3, 2019 | |||||||||||||||
| Gross Carrying Amount | Accumulated Amortization | Net Carrying Amount |
|||||||||||||
| Patents | 10 Years | $ | 1,406,336 | $ | (744,715 | ) | $ | 661,621 | |||||||
| Trademarks | 3 Years | 868,586 | (589,248 | ) | 279,338 | ||||||||||
| Other intangibles | 5 Years | 839,737 | (838,365 | ) | 1,372 | ||||||||||
| Total | $ | 3,114,659 | $ | (2,172,328 | ) | $ | 942,331 | ||||||||
| February 4, 2018 | ||||||||||||||
| Estimated Life |
Gross Carrying Amount | Accumulated Amortization | Net Carrying Amount |
|||||||||||
| Patents | 10 Years | $ | 1,056,604 | $ | (674,660 | ) | $ | 381,944 | ||||||
| Trademarks | 3 Years | 603,807 | (500,763 | ) | 103,044 | |||||||||
| Other Intangibles | 5 Years | 839,738 | (798,356 | ) | 41,382 | |||||||||
| Total | $ | 2,500,149 | $ | (1,973,779 | ) | $ | 526,370 | |||||||
Amortization expense on other intangible assets was $198,549 in fiscal 2019 and $218,308 in fiscal 2018.
F-18
THE LOVESAC COMPANY
CONSOLIDATED NOTES TO FINANCIAL STATEMENTS
FEBRUARY 3, 2019 AND FEBRUARY 4, 2018
Note 3 – Other Intangible Assets, Net (Continued)
Expected amortization expense by fiscal year for these other intangible assets follows:
| 2020 | 196,960 | |||
| 2021 | 176,690 | |||
| 2022 | 136,465 | |||
| 2023 | 75,466 | |||
| 2024 | 75,396 | |||
| Thereafter | 281,354 | |||
| $ | 942,331 |
Note 4 – Prepaid Expenses and Other Current Assets
A summary of other prepaid and other current assets follows:
| 2019 | 2018 | |||||||
| Prepaid insurance | $ | 760,974 | $ | 463,661 | ||||
| Prepaid catalogue costs | 1,633,960 | 1,750,204 | ||||||
| Barter credits | - | 307,417 | ||||||
| Deposits | 732,938 | 400,000 | ||||||
| Prepaid rent | 1,036,647 | 1,207,812 | ||||||
| Prepaid inventory | 575,397 | 355,053 | ||||||
| Other | 1,193,956 | 1,578,799 | ||||||
| $ | 5,933,872 | $ | 6,062,946 | |||||
F-19
THE LOVESAC COMPANY
CONSOLIDATED NOTES TO FINANCIAL STATEMENTS
FEBRUARY 3, 2019 AND FEBRUARY 4, 2018
Note 5 – Income Taxes
On December 22, 2017, the Federal government of the United States enacted the U.S. Tax Cuts and Jobs Act (the “Tax Act”) which significantly changed existing U.S. tax laws including a reduction in the federal corporate income tax rate from 35% to 21%, repeal of the corporate alternative minimum tax (“AMT”) and refund certain existing AMT credits over several years, introduction of a capital investment deduction, limitation of the interest deduction, limitation of the use of net operating losses incurred on or after January 1, 2018 to offset future taxable income, limitation of the deduction for compensation paid to certain executive officers and extensive changes to the U.S. international tax system, as well as other changes. These changes generally took effect on January 1, 2018. The Company’s federal net operating losses that have been incurred prior to December 31, 2017 will continue to have a 20-year carryforward limitation applied and will need to be evaluated for recoverability in the future as such. Net operating losses incurred after December 31, 2017 will have an indefinite life, but usage will be limited to 80% of taxable income in any given year. On December 22, 2017, the SEC issued Staff Accounting Bulletin 118 (“SAB 118”), which provides guidance on accounting for tax effects of the Tax Act, SAB 118 provides a measurement period that should not extend beyond one year from the Tax Act enactment date for companies to complete the accounting under ASC 740. In accordance with SAB 118, the Company has finalized the income tax effects of the Tax Act as of February 3, 2019 and had no change to its original estimates.
The components of deferred income taxes follow:
| 2019 | 2018 | |||||||
| Deferred Income Tax Assets | ||||||||
| Federal net operating loss carryforward | $ | 708,865 | $ | 9,211,499 | ||||
| State net operating loss carryforward | 130,924 | 2,130,112 | ||||||
| Intangible assets | 248,731 | 318,158 | ||||||
| Accrued liabilities | 1,139,686 | 515,392 | ||||||
| Equity based compensation | 171,120 | 38,807 | ||||||
| Property and equipment | 1,165,359 | 985,871 | ||||||
| Merchandise inventories | 154,599 | 63,415 | ||||||
| Total Deferred Income Tax Assets | 3,719,284 | 13,263,254 | ||||||
| Valuation Allowance | (3,719,284 | ) | (13,263,254 | ) | ||||
| Net Deferred Income Tax Asset | $ | - | $ | - | ||||
The income tax provision differs from the amount obtained by applying the statutory Federal income tax rate to pretax income as follows:
| 2019 | 2018 | |||||||
| (Benefit) at Federal Statutory rates | $ | (1,397,881 | ) | $ | (1,861,772 | ) | ||
| Permanent adjustments | 406,674 | 62,491 | ||||||
| State tax, net of Federal benefit | (15,086 | ) | (265,277 | ) | ||||
| Change in Federal rate from 34% to 21% | - | 6,658,540 | ||||||
| Federal True-ups | (175,845 | ) | (403,322 | ) | ||||
| Uncertain tax positions – NOLS | 10,753,384 | - | ||||||
| Change in valuation allowance | (9,554,839 | ) | (4,164,660 | ) | ||||
| Income tax provision | $ | 16,407 | $ | 26,000 | ||||
The Company is subject to federal, state and local corporate income taxes. The components of the provision for income taxes reflected on the consolidated statements of operations are set forth below:
| 2019 | 2018 | |||||||
| Current taxes: | ||||||||
| U.S. federal | $ | - | $ | - | ||||
| State and local | 16,407 | 26,000 | ||||||
| Total current tax expense (benefit) | $ | 16,407 | $ | 26,000 | ||||
| Deferred taxes: | ||||||||
| U.S. federal | $ | - | $ | - | ||||
| State and local | - | - | ||||||
| Total deferred tax expense (benefit) | - | - | ||||||
| Total tax (benefit) provision | $ | 16,407 | $ | 26,000 | ||||
F-20
THE LOVESAC COMPANY
CONSOLIDATED NOTES TO FINANCIAL STATEMENTS
FEBRUARY 3, 2019 AND FEBRUARY 4, 2018
Note 5 – Income Taxes (Continued)
Differences in terms of percentages are as follows:
| 2019 | 2018 | |||||||
| (Benefit) at Federal Statutory rates | (21.0 | )% | (34.0 | )% | ||||
| Permanent adjustments | 6.1 | % | 1.1 | % | ||||
| State tax, net of Federal benefit | (0.2 | )% | (4.8 | )% | ||||
| Change in Federal rate from 34% to 21% | - | 121.6 | % | |||||
| Federal True-ups | (2.6 | )% | (7.3 | )% | ||||
| Uncertain tax positions- NOLs | 161.5 | % | - | |||||
| Change in valuation allowance | (143.5 | )% | (76.1 | )% | ||||
| Income tax (benefit) provision | 0.3 | % | 0.5 | % | ||||
At February 3, 2019 and February 4, 2018, pending the determination of the IRS that the NOLs of SAC were effectively inherited by the Company in the 2017 reorganization, the Company had net operating loss carryforwards available for federal income tax purposes of approximately $45,190,000 and $43,864,000, respectively, which are scheduled to expire in varying amounts from fiscal 2027 to fiscal 2037. In addition, the Company had approximately $35,674,000 and $35,908,000 of state net operating loss carryforwards as of February 3, 2019 and February 4, 2018, respectively. An allowance has been recorded against the net operating losses in accordance with ASC 740-10. The federal and state net operating loss net of reserves were $3,376,000 and $2,334,000 respectively for the fiscal year ended February 3, 2019.
As defined in Section 382 of the Internal Revenue Code, certain ownership changes limit the annual utilization of federal net operating losses. As a result of the issuance, sales and other transactions involving the Company’s stock, the Company experienced an ownership change during the fiscal year ended February 3, 2019 which could cause such federal net operating losses to be subject to limitation under Section 382. There is no impact on the overall provision in the event the federal net operating losses are limited since the Company has a full valuation allowance against its deferred tax assets.
The Company is currently working with the IRS to resolve an administrative issue related to the amount and nature of its NOLs. The Company has consistently maintained a full valuation allowance against its NOLs. Accordingly, the resolution of the uncertain tax position regarding the Company’s NOL carryforward will have no impact on the Company’s financial position or results of operations.
During the fiscal years ended February 3, 2019 and February 4, 2018, the Company increased/(decreased) the valuation allowance by approximately ($9,555,000) and ($4,165,000) respectively.
The changes in the amount of unrecognized tax benefits in fiscal 2019 and fiscal 2018 were as follows:
| 2019 | 2018 | |||||||
| Beginning balance | $ | - | $ | - | ||||
| Additions for tax positions acquired | - | - | ||||||
| Additions for tax positions related to current year | 10,753,384 | - | ||||||
| Tax positions of prior years: | ||||||||
| Payments | - | - | ||||||
| Settlements | - | - | ||||||
| Due to lapsed SOL | - | - | ||||||
| Ending balance | $ | 10,753,384 | $ | - | ||||
The Company adopted FASB ASU 2013-11. The pronouncement requires the Company to offset its uncertain tax positions against certain deferred tax assets in the same jurisdiction. As of February 3, 2019, the Company reclassified $10,753,384 of its uncertain tax positions against its related deferred tax assets.
F-21
THE LOVESAC COMPANY
CONSOLIDATED NOTES TO FINANCIAL STATEMENTS
FEBRUARY 3, 2019 AND FEBRUARY 4, 2018
Note 6 – Commitments, Contingencies And Related Parties
Operating Lease Commitments
The Company leases its office, warehouse facilities and retail showrooms under operating lease agreements which expire at various dates through November 2027. Monthly payments related to these leases range from $2,500 to $24,600. Total rent expense including common area maintenance charges and sales percentage rent was $16,245,590 in fiscal 2019 and $11,722,255 in fiscal 2018.
Expected future annual minimum rental payments under these leases follow:
| 2020 | $ | 9,350,423 | ||
| 2021 | 8,683,571 | |||
| 2022 | 7,862,414 | |||
| 2023 | 7,628,815 | |||
| 2024 | 7,350,258 | |||
| Thereafter | 20,253,484 | |||
| $ | 61,128,965 |
The above disclosure includes lease extensions for various retail showrooms the Company entered into after year end.
Severance Contingency
The Company has various employment agreements with its senior level executives. A number of these agreements have severance provisions, ranging from 12 to 18 months of salary, in the event those employees are terminated without cause. The total amount of exposure to the Company under these agreements was $2,905,640 at February 3, 2019 if all executives with employment agreements were terminated without cause and the full amount of severance was payable.
F-22
THE LOVESAC COMPANY
CONSOLIDATED NOTES TO FINANCIAL STATEMENTS
FEBRUARY 3, 2019 AND FEBRUARY 4, 2018
Note 6 – Commitments, Contingencies And Related Parties (Continued)
Related Parties
Mistral Capital Management, LLC (“Mistral”), an affiliate of a stockholder of the Company, performs management services for the Company under a contractual agreement. Management fees totaled approximately $400,000 in both fiscal 2019 and in fiscal 2018 and are included in selling, general and administrative expenses. Transaction fees related to the IPO were $500,000 in fiscal 2019 and are included in selling, general and administrative expenses. No transaction fees were incurred during fiscal 2018. Amounts payable to Mistral as of February 3, 2019 and February 4, 2018 were $0 and $121,103, respectively, and are included in accounts payable in the accompanying balance sheets.
Satori Capital, LLC (“Satori”), an affiliate of two stockholders of the Company since April 2017, performs management services for the Company under a contractual agreement. Management fees totaled approximately $100,000 in both fiscal 2019 and fiscal 2018 and are included in selling, general and administrative expenses. Transaction fees related to the IPO were $125,000 in fiscal 2019 and there were no transaction fees in fiscal 2018. A one-time stock bonus of 50,000 shares of common stock at $14.83 per share, or $741,500, is included in equity-based compensation on the accompanying consolidated statement of changes in stockholders’ equity and issued on June 22, 2018. The bonus was issued to Satori in three installments; two equal installments of 5,000 shares of common stock in August 2018 and September 2018 and the remainder of the shares were issued in October 2018. All fees and the stock bonus are included in selling, general and administrative expenses in the accompanying consolidated statements of operations. There were no amounts payable to Satori as of February 3, 2019 and February 4, 2018.
In fiscal 2017, the Company engaged Blueport Commerce (“Blueport”), a company owned in part by investment vehicles affiliated with Mistral and an affiliate of Schottenstein Stores Corporation, an indirect investor in Sac Acquisition LLC. to evaluate a transition plan to convert to the Blueport platform. Certain of the Company’s directors are members and principals of Mistral or employees of Schottenstein Stores Corporation. The Company launched on the Blueport platform in February 2018. There were $1,153,844 of fees incurred with Blueport for the conversion to, and sales transacted through, the Blueport platform during fiscal 2019. Transition plan fees of $0 and $15,235 were incurred with Blueport during fiscal 2019 and fiscal 2018, respectively. Amounts payable to Blueport as of February 3, 2019 and February 4, 2018 were $93,210 and $15,235, respectively, and are included in accounts payable and accrued expenses in the accompanying consolidated balance sheets.
Note 7 – Stockholders’ Equity
On June 22, 2018, the board of directors of the Company approved a 1-for-2.5 reverse stock split of the Company’s shares of common stock. The reverse stock split became effective immediately prior to the closing of its initial public offering (“IPO”). All stock amounts included in these financial statements have been adjusted to reflect this reverse stock split.
On June 27, 2018, the Company completed its IPO, selling 4,025,000 shares of common stock at a price of $16.00 per share. Net proceeds to the Company from the offering was approximately $59.2 million after legal and underwriting expenses.
On October 29, 2018, certain selling stockholders conducted a secondary offering of 2,220,000 shares of common stock of the Company. The Company did not sell any shares or receive any proceeds from the sale of the common stock by the selling stockholders.
F-23
THE LOVESAC COMPANY
CONSOLIDATED NOTES TO FINANCIAL STATEMENTS
FEBRUARY 3, 2019 AND FEBRUARY 4, 2018
Note 7 – Stockholders’ Equity (Continued)
Preferred Stock
In fiscal 2018, the Company completed financing transactions with funds and investment vehicles advised by Mistral, Satori, executive management and third-party investors. As part of the transactions, the Company received $21,139,845 in cash (net of issuance costs of $1,325,156) in exchange for a total of 2,247 Series A, A-1 and A-2 Preferred Units (preferred stock equivalent of 2,237,000 shares) and warrants to purchase 798,975 shares of common stock, subject to adjustments in the exercise price. The preferred stock carried an annual dividend of 8% compounded and conversion rights dependent upon certain events occurring.
In order to eliminate all outstanding preferred stock upon completion of the IPO, on April 19, 2018, the Company and the majority holders of each of the Series A Preferred Stock, the Series A-1 Preferred Stock and the Series A-2 Preferred Stock agreed to amend and restate each series of preferred stock to, among other things, revise the conversion features of the preferred stock to provide that, immediately prior to the closing of an initial public offering, the preferred stock:
(1) would accrue an additional amount of dividends equal to the amount of dividends that would have accrued and accumulated through and including the one-year anniversary of the completion of the initial public offering,
(2) would, along with the aggregate accrued or accumulated and unpaid dividends thereon, automatically convert into shares of common stock at a price per share equal to the lesser of (a) 70% of the offering price, or (b) the applicable calculation set forth pursuant to the terms of their respective certificates of designation.
All outstanding preferred stock totaling $25,645,000, including the additional year of dividends of $2,037,200 and accumulated dividends at 8% through June 29, 2018 of $2,495,704 was converted into 3,287,441 shares of common stock upon completion of the Company’s IPO on June 29, 2018. The preferred stock converted to common stock at $9.13 per share resulting in a deemed dividend of $22,601,161 related to the conversion.
F-24
THE LOVESAC COMPANY
CONSOLIDATED NOTES TO FINANCIAL STATEMENTS
FEBRUARY 3, 2019 AND FEBRUARY 4, 2018
Note 7 – Stockholders’ Equity (Continued)
Common Stock Warrants
In fiscal 2018, as noted above, the Company completed financing transactions with funds and investment vehicles advised by Mistral, Satori, executive management and third-party investors in which the Company originally issued warrants to purchase an aggregate total of $15,979,500 shares of common stock subject to adjustments in the exercise price as defined below.
In consideration for agreeing to amend the outstanding preferred stock to automatically convert immediately prior to the completion of the IPO, on April 19, 2018, the Company and a majority of the holders of the warrants issued along with the preferred stock, agreed to amend and restate the warrants to replace the aggregate dollar value of each warrant with a fixed number of warrant shares. In order to prevent dilution of the purchase rights granted under the warrants, the exercise price shall be calculated as follows:
I. If, prior to the exercise of the warrant, the Company completes its initial public offering of Common Stock (“Qualified IPO”), the exercise price per warrant share shall, subject to certain provisions, be equal to the purchase price per share of Common Stock in the Qualified IPO;
II. If, prior to the exercise of the warrant and prior to a Qualified IPO, the Company completes a third party equity or equity-linked financing with an institutional investor resulting in aggregate gross proceeds to the Company of at least $15,000,000 (a “Qualified Financing”), the exercise price per warrant share shall be equal to the purchase price per share of Common Stock in the Qualified Financing (subject to adjustment); provided, however, that following completion of a Qualified IPO, the exercise price per Warrant Share shall be the lower of the exercise price (the “Qualified Exercise Price”);
III. If, prior to exercise of the warrant, the Company has not completed a Qualified IPO or Qualified Financing, the exercise price per warrant share shall be determined based on a valuation of the Company prior to such exercise of $80 million (the “Valuation Exercise Price,” and together with the IPO Exercise Price or the Qualified Exercise Price, as the case may be, the “Exercise Price”); or
IV. If there is Qualified Financing subsequent to a previous Qualified Financing and prior to a Qualified IPO, the Exercise Price per warrant share shall be equal to the lesser of the then current Exercise Price immediately prior to such subsequent Qualified Financing and the purchase price or deemed purchase price per share of Common Stock in the subsequent Qualified Financing.
As a result of the modification, on April 19, 2018, the Company updated the fair value of the warrants using the assumptions detailed below using a probability-weighted expected return. As the total fair value of the modified warrants was less than the total fair value of the original warrants, there was no financial statement impact on April 19, 2018. On June 29, 2018, the Company completed a Qualified IPO and the exercise price was adjusted to equal the purchase price per share of common stock of $16.00. The Company computed the value of the warrants with the updated assumptions using the Black-Scholes Model, as described below, and recorded the difference between the fair value of the new warrants compared to the old warrants as a deemed dividend of $1,498,079.
There were 281,750 warrants, with a five-year term, issued to Roth Capital Partners, LLC as part of the underwriting agreement in connection with the Company’s IPO. These warrants were valued using the Black-Scholes model.
In fiscal 2019, the Company amended and restated warrants totaling 56,077 with a three-year term, valued using the Black-Scholes model. The Company recorded the difference between the fair value of the new warrants compared to the old warrants as a deemed dividend of $408,919.
F-25
THE LOVESAC COMPANY
CONSOLIDATED NOTES TO FINANCIAL STATEMENTS
FEBRUARY 3, 2019 AND FEBRUARY 4, 2018
Note 7 – Stockholders’ Equity (Continued)
Common Stock Warrants (continued)
The warrants may be exercised at any time following the date of issuance during the period prior to their expiration date. The fair value of each warrant is estimated on the date of grant using the Black-Scholes model. Expected volatilities are based on comparable Companies’ historical volatility, which management believes represents the most accurate basis for estimating expected future volatility under the current circumstances. The risk-free rate is based on the U.S. treasury yield in effect at the time of the grant. The Black-Scholes model assumptions are noted in the following table:
| April
19, 2018 |
June 29, 2018 | June 29, 2018 | September 26, 2018 | |||||||||||||
| Warrants | 798,795 | 798,795 | 281,750 | 56,077 | ||||||||||||
| Expected volatility | 41.4% - 43.7 | % | 42.0 | % | 41.3 | % | 43.8 | % | ||||||||
| Expected dividend yield | 0 | % | 0 | % | 0 | % | 0 | % | ||||||||
| Expected term (in years) | 3.10 | 3.00 | 5.00 | 3.00 | ||||||||||||
| Risk-free interest rate | 1.7% - 2.0 | % | 2.6 | % | 2.7 | % | 2.69 | % | ||||||||
| Exercise price | $ | 14.80 | $ | 16.00 | $ | 19.20 | $ | 9.13 | ||||||||
| Calculated fair value of warrant | $ | 3.12 | $ | 5.00 | $ | 8.84 | $ | 12.87 | ||||||||
Total warrants outstanding as of February 3, 2019 and February 4, 2018, were as follows:
| Average Exercise Price | Number of Warrants | Weighted Average Remaining Life | ||||||||||
| Outstanding at January 30, 2017 | $ | - | - | - | ||||||||
| Warrants issued | 17.18 | 930,054 | 3.86 | |||||||||
| Expired and canceled | - | - | - | |||||||||
| Exercised | - | - | - | |||||||||
| Outstanding at February 4, 2018 | 17.18 | 930,054 | 3.24 | |||||||||
| Warrants issued | 18.56 | 1,136,802 | 3.65 | |||||||||
| Expired and canceled | 17.18 | (930,054 | ) | (3.20 | ) | |||||||
| Exercised | 10.44 | (69,327 | ) | (2.68 | ) | |||||||
| Warrants Outstanding at February 3, 2019 | $ | 16.83 | 1,067,475 | 2.93 | ||||||||
The Company early adopted ASU 2017-11, which addresses the accounting for warrants with down round features that result in the strike price being reduced on the basis of the pricing of future equity offerings, which allowed the Company to account for the warrants issued along with the preferred raise in fiscal 2018 as equity versus a liability.
F-26
THE LOVESAC COMPANY
CONSOLIDATED NOTES TO FINANCIAL STATEMENTS
FEBRUARY 3, 2019 AND FEBRUARY 4, 2018
Note 7 – Stockholders’ Equity (Continued)
equity incentive plans
In October 2017, the Company adopted the 2017 Equity Incentive Plan (the “Plan”) which provides for Awards in the form of Options, Stock Appreciation rights, Restricted Stock Awards, Restricted Stock Units, Performance shares, Performance Units, Cash-Based Awards and Other Stock-Based Awards. In April 2018, the board of directors of the Company approved an increase in shares of common stock reserved for issuance under the Plan from 420,000 to 604,612 shares of common stock.
On May 10, 2018, the board of directors approved an increase in shares of common stock reserved for issuance under the Plan from 604,612 to 615,066 shares of common stock.
All awards shall be granted within 10 years from the effective date of the Plan.
In October 2017, the Company granted 258,000 Restricted Stock Units to certain officers of the Company with a fair value of $2,792,849. As of February 3, 2019, there were 161,250 unvested units outstanding related to this grant. The unit vesting was based on both time and performance. The time vesting units vest twenty-five percent on January 31, 2018, and twenty-five percent on each of the next three anniversaries of that initial vesting date. The performance vesting units vest annually upon the achievement of certain benchmarks. There were no Restricted Stock Units cancelled, forfeited, or expired during the fiscal year ended February 3, 2019 related to these grants.
In March 2018, the Company granted 52,504 Restricted Stock Units to certain executive employees of the Company with a fair value of $568,356. As of February 3, 2019, there were 32,817 unvested units outstanding related to this grant. The unit vesting was based on both time and performance. The time vesting units vest twenty-five percent on May 1, 2018, and twenty-five percent on January 31st of the following three years. The performance vesting units vest annually upon the achievement of certain benchmarks. There were no Restricted Stock Units cancelled, forfeited, or expired during the fiscal year ended February 3, 2019 related to these grants.
On May 10, 2018, the Company granted 188,917 Restricted Stock Units to certain officers of the Company with a fair value of $2,800,695. As of February 3, 2019, there were 118,073 unvested units outstanding related to this grant. The vesting of the restricted stock units is based on both time and performance. The time vesting units vest twenty-five percent on the closing of the IPO, and twenty-five percent on January 31st of the following three years. The performance vesting units vest annually upon the achievement of certain benchmarks. There were no Restricted Stock Units cancelled, forfeited, or expired during the fiscal year ended February 3, 2019 related to these grants.
On June 20, 2018, the Company granted to certain executive and non-executive employees of the Company an aggregate of 68,378 Restricted Stock Units, with a fair value of $1,014,046 of which 15,666 Restricted Stock Units, immediately vested. The vesting of the unvested Restricted Stock Units is based on both time and performance. The time and performance vesting units will vest twenty-five percent on July 1, 2019, and July 1, 2020 and between twenty-five to thirty-five percent on July 1, 2021. The performance vesting units will only vest upon the achievement of certain benchmarks. As of February 3, 2019, there were 48,083 unvested units outstanding related to this grant. There were 4,629 units forfeited from this grant during the fiscal year ended February 3, 2019.
In September 2018, the Company granted a certain executive employee of the Company 10,500 Restricted Stock Units with a fair value of $250,950. As of February 3, 2019, there were 6,563 unvested units outstanding related to this grant. The unit vesting was based on both time and performance. The time vesting units vest twenty-five percent on October 4, 2018, and twenty-five percent on January 31st of the following three years. The performance vesting units vest annually upon the achievement of certain benchmarks. There were no Restricted Stock Units cancelled, forfeited, or expired during the fiscal year ended February 3, 2019 related to these grants.
In January 2019, the Company granted a certain executive employee of the Company 10,500 Restricted Stock Units with a fair value of $246,120. As of February 3, 2019, there were 10,500 unvested units outstanding related to this grant. The unit vesting was based on both time and performance. The time vesting units vest twenty-five percent on January 31, 2020, and twenty-five percent on January 31st of each of the following three years. The performance vesting units vest annually upon the achievement of certain benchmarks. There were no restricted stock units cancelled, forfeited, or expired during the fiscal year ended February 3, 2019.
F-27
THE LOVESAC COMPANY
CONSOLIDATED NOTES TO FINANCIAL STATEMENTS
FEBRUARY 3, 2019 AND FEBRUARY 4, 2018
Note 7 – Stockholders’ Equity (Continued)
equity incentive plans (continued)
A summary of the status of the Company’s unvested restricted stock units as of February 3, 2019 and February 4, 2018, and changes during the years then ended, is presented below:
| Number of shares | Weighted
average grant date fair value | |||||||
| Unvested at January 30, 2017 | - | $ | - | |||||
| Granted | 258,000 | 10.83 | ||||||
| Forfeited | - | - | ||||||
| Vested | (64,500 | ) | 10.83 | |||||
| Unvested at February 4, 2018 | 193,500 | 10.83 | ||||||
| Granted | 330,799 | 14.76 | ||||||
| Forfeited | (4,629 | ) | 14.83 | |||||
| Vested | (142,384 | ) | 13.62 | |||||
| Unvested at February 3, 2019 | 377,286 | $ | 11.16 | |||||
Stock compensation expense related to the above restricted stock units was $2,568,518 for fiscal 2019, and $846,747 for fiscal 2018.
The total unrecognized restricted stock unit compensation cost related to non-vested awards was $1,315,947 as of February 3, 2019 and will be recognized in operations over a weighted average period of 2.24 years.
F-28
THE LOVESAC COMPANY
CONSOLIDATED NOTES TO FINANCIAL STATEMENTS
FEBRUARY 3, 2019 AND FEBRUARY 4, 2018
Note 8 – Employee Benefit plan
In February 2017, the Company established The Lovesac Company 401(k) Plan (the “Plan”) with Elective Deferrals beginning May 1, 2017. The Plan calls for Elective Deferral Contributions, Safe Harbor Matching Contributions and Profit Sharing Contributions. All employees of the Company will be eligible to participate in the Plan as of the day of the month which is coincident with or next follows the date on which they attain age 21 and complete 1 month of service. Participants will be able to contribute up to 100% of their eligible compensation to the plan subject to limitations with the IRS. The employer contributions to the Plan for fiscal 2019 and 2018 were approximately $303,000 and $156,000, respectively.
Note 9 – Financing Arrangements
Note Payable
In July 2016, the Company entered into a one year note payable arrangement for $500,000 with American Express Merchant Financing (Amex) that bore interest at 3.5%. Principal and interest payments on this note were made by Amex withholding 6% of the Company’s Amex credit card remittances. The note expired on June 29, 2017 and was paid in full in fiscal 2018.
Credit Lines
The Company had a line of credit with Siena Lending Group, LLC to borrow up to $7.0 million, which matured on May 14, 2018. Borrowings were limited to the lesser of 75% of inventory or 85% of the net orderly liquidation value of inventory and could be reduced by certain liabilities of the Company. All amounts outstanding bore interest at the base rate, defined as the greatest of (i) Prime Rate published by The Wall Street Journal, (ii) Federal Funds Rate plus 0.5% or (iii) 3.25%, plus 3% (7.00% at February 4, 2018). The line was subject to a monthly unused line fee of 0.75%. The agreement was secured by the first lien on substantially all assets of the Company. In February 2018, the Company paid the outstanding loan balance of $405, an early termination fee of $70,000 and fully amortized the remaining deferred financing fees of $48,149 on its line of credit with Siena Lending Group, LLC.
On February 6, 2018, the Company established a line of credit with Wells Fargo Bank, National Association (“Wells”). The line of credit with Wells allows the Company to borrow up to $25.0 million and will mature in February 2023. Borrowings are limited to 90% of eligible credit card receivables plus 85% of eligible wholesale receivables plus 85% of the net recovery percentage for the eligible inventory multiplied by the value of such eligible inventory of the Company for the period from December 16 of each year until October 14 of the immediately following year, with a seasonal increase to 90% of the net recovery percentage for the period from October 15 of each year until December 15 of such year, minus applicable reserves established by Wells. As of February 3, 2019, the Company’s borrowing availability under the line of credit with Wells Fargo was $11.5 million. As of February 3, 2019, there was $31,373 outstanding on this line of credit related to unused line fee charges.
Under the line of credit with Wells, the Company may elect that revolving loans bear interest at a rate per annum equal to the base rate plus the applicable margin or the LIBOR rate plus the applicable margin. The applicable margin is based on tier’s relating to the quarterly average excess availability. The tiers range from 2.00% to 2.25%. The loan agreement calls for certain covenants including a timing of the financial statements threshold and a minimum excess availability threshold. On May 3, 2018, the Company elected a one-month revolving loan with a maturity date of June 4, 2018, that bore interest at the LIBOR rate plus the applicable margin for an all-in-rate of 3.1875%. The one-month revolving loan matured and was paid in full on June 4, 2018.
F-29
THE LOVESAC COMPANY
CONSOLIDATED NOTES TO FINANCIAL STATEMENTS
FEBRUARY 3, 2019 AND FEBRUARY 4, 2018
Note 10 – Segment Information
The Company operates within a single reporting segment. The chief operating decision maker of the Company is the Chief Executive Officer and President. The Company’s operating segments are aggregated for financial reporting purposes because they are similar in each of the following areas including economic characteristics, class of consumer, nature of products and distribution method and products are a singular group of products which make up over 95% of total sales.
The Company’s sales by product which are considered one segment are as follows:
| Fiscal year ending | ||||||||
| February 3, 2019 | February 4, 2018 | |||||||
| Sactionals | $ | 120,205,061 | $ | 72,562,546 | ||||
| Sacs | 41,174,831 | 26,854,616 | ||||||
| Other | 4,501,405 | 2,393,250 | ||||||
| $ | 165,881,297 | $ | 101,810,413 | |||||
Note 11 – Barter Arrangements
In fiscal 2018, the Company entered into a barter arrangement with Icon International, Inc., a vendor, where the Company provided inventory in exchange for media credits. During fiscal 2018, the Company exchanged $577,326 of inventory plus the cost of freight for certain media credits. To account for the exchange, the Company recorded the transfer of the inventory asset as a reduction of inventory and an increase to a prepaid media asset of $534,407 which is included in “Prepaid and other current assets” on the accompanying consolidated balance sheet. The Company had $307,417 of unused media credits remaining as of February 4, 2018 that were used in full during fiscal 2019.
The Company accounts for barter transactions under ASC Topic No. 845 “Nonmonetary Transactions.” Barter transactions with commercial substance are recorded at the estimated fair value of the products exchanged, unless the products received have a more readily determinable estimated fair value. Revenue associated with barter transactions is recorded at the time of the exchange of the related assets.
Note 12 – Subsequent Events
The Company has evaluated events and transactions subsequent to February 3, 2019 through the date the consolidated financial statements were issued.
On March 22, 2019, all unvested restricted stock units for certain senior executives of the Company vested according to the accelerated vesting trigger in their restricted stock unit agreements. The triggering event was the market capitalization of Company, post IPO, exceeding $300 million for 60 consecutive trading days and the expiration of the lock-up period. A total of 279,325 restricted stock units vested resulting in approximately $3.5 million in additional RSU compensation expense.
F-30
[●] Shares

THE LOVESAC COMPANY
Common Stock
PROSPECTUS
[●], 2019
Sole Book-Running Manager
| Stifel |
No finder, dealer, sales person or other person has been authorized to give any information or to make any representation in connection with this offering other than those contained in this prospectus and, if given or made, such information or representation must not be relied upon as having been authorized by our Company. This prospectus does not constitute an offer to sell or a solicitation of an offer to buy any of the securities offered hereby by anyone in any jurisdiction in which such offer or solicitation is not authorized or in which the person making such offer or solicitation is not qualified to do so or to any person to whom it is unlawful to make such offer or solicitation. The information contained in this prospectus is accurate only as of the date of this prospectus, regardless of the time of delivery of this prospectus or any sale of these securities. Our business, financial condition, results of operation and prospects may have changed after the date of this prospectus.
Through and including [●], 2019 (the 25th day after the date of this prospectus), all dealers effecting transactions in our common stock, whether or not participating in our initial public offering, may be required to deliver a prospectus. This delivery requirement is in addition to a dealer’s obligation to deliver a prospectus when acting as an underwriter and with respect to an unsold allotment or subscription.
PART II
INFORMATION NOT REQUIRED IN PROSPECTUS
Item 13. Other Expenses of Issuance and Distribution.
The following table sets forth all expenses to be paid by the registrant, other than underwriting discounts, in connection with our public offering. All amounts shown are estimates except for the SEC registration free and the FINRA filing fee:
| SEC registration fee | $ | [●] | ||
| FINRA filing fee | [●] | |||
| Exchange listing fee | - | |||
| Legal fees and expenses | [●] | |||
| Accounting fees and expenses | [●] | |||
| Transfer agent and registrar fees | [●] | |||
| Printing expenses | [●] | |||
| Miscellaneous expenses | [●] | |||
| Total | $ | [●] |
Item 14. Indemnification of Directors and Officers.
Section 145 of the Delaware General Corporation Law authorizes the board of directors of a corporation to grant, and authorizes a court to award, indemnity to officers, directors and other corporate agents.
Our certificate of incorporation contains provisions that limit the liability of our directors for monetary damages to the fullest extent permitted by Delaware law. Consequently, our directors will not be personally liable to us or our stockholders for monetary damages for any breach of fiduciary duties as directors, except liability for the following:
| ● | any breach of their duty of loyalty to the Company or our stockholders; |
| ● | any act or omission not in good faith or that involves intentional misconduct or a knowing violation of law; |
| ● | unlawful payments of dividends or unlawful stock repurchases or redemptions as provided in Section 174 of the Delaware General Corporation Law; or |
| ● | any transaction from which they derived an improper personal benefit. |
Any amendment to, or repeal of, these provisions will not eliminate or reduce the effect of these provisions in respect of any act, omission or claim that occurred or arose prior to that amendment or repeal. If the Delaware General Corporation Law is amended to provide for further limitations on the personal liability of directors of corporations, then the personal liability of our directors will be further limited to the greatest extent permitted by the Delaware General Corporation Law.
In addition, our bylaws provide that we will indemnify, to the fullest extent permitted by law, any person who was or is made or is threatened to be made a party or is otherwise involved in any action, suit or proceeding, whether civil, criminal, administrative or investigative (a “proceeding”), by reason of the fact that he or she, or a person for whom he or she is the legal representative, is or was a director or officer of the corporation or, while a director or officer of the corporation, is or was serving at the request of the corporation as a director, officer, employee or agent of another corporation or of a partnership, joint venture, trust, enterprise or nonprofit entity, including service with respect to employee benefit plans, against all liability and loss suffered and expenses (including attorneys’ fees) reasonably incurred. Our bylaws also provide that we must pay the expenses (including attorneys’ fees) incurred by a director or officer in defending any proceeding in advance of its final disposition, subject to limited exceptions.
The limitation of liability and indemnification provisions that are included in our certificate of incorporation, bylaws and in indemnification agreements that we have entered into or will enter into with our directors and executive officers may discourage stockholders from bringing a lawsuit against our directors and executive officers for breach of their fiduciary duties. They may also reduce the likelihood of derivative litigation against our directors and executive officers, even though an action, if successful, might benefit us and other stockholders. Further, a stockholder’s investment may be adversely affected to the extent that we pay the costs of settlement and damage awards against directors and executive officers as required by these indemnification provisions. At present, we are not aware of any pending litigation or proceeding involving any person who is or was one of our directors, officers, employees or other agents or is or was serving at our request as a director, officer, employee or agent of another corporation, partnership, joint venture, trust or other enterprise, for which indemnification is sought, and we are not aware of any threatened litigation that may result in claims for indemnification.
II-1
We have obtained insurance policies under which, subject to the limitations of the policies, coverage is provided to our directors and executive officers against loss arising from claims made by reason of breach of fiduciary duty or other wrongful acts as a director or executive officer, including claims relating to public securities matters, and to us with respect to payments that may be made by us to these directors and executive officers pursuant to our indemnification obligations or otherwise as a matter of law. Some of our non-employee directors may, through their relationships with their employers, be insured or indemnified against liabilities incurred in their capacity as members of our board of directors.
The underwriting agreement filed as Exhibit 1.1 to this registration statement will provide for indemnification by the underwriters of us and our officers and directors for liabilities arising under the Securities Act or otherwise.
Item 15. Recent Sales of Unregistered Securities.
Set forth below is information regarding securities sold and issued by us in the last three years that were not registered under the Securities Act, as well as the consideration received by us for such securities and information relating to the section of the Securities Act, or rules of the SEC, under which exemption from registration was claimed.
On March 27, 2017, we completed a bridge financing, pursuant to which we sold to entities affiliated with Satori Capital, LLC, $10,000,000 of Series A-1 Preferred Stock and five-year warrants, as amended, to purchase 350,000 shares of common stock at an exercise price equal to the price per share of this offering, subject to adjustments.
Between March 2017 and October 2017, we completed a bridge financing, pursuant to which we sold to 31 accredited investors $9,230,000 of Series A Preferred Stock and five-year warrants, as amended, to purchase 230,750 shares of common stock at an exercise price equal to the price per share of this offering, subject to adjustments.
On October 19, 2017, we completed a private placement, pursuant to which we sold to entities affiliated with Satori Capital, LLC, $4,000,000 of Series A-2 Preferred Stock and five-year warrants, as amended, to purchase 140,000 shares of common stock at an exercise price equal to the price per share of this offering, subject to adjustments.
In December 2017, we completed a private placement, pursuant to which we sold to Shawn Nelson, our Chief Executive Officer, Jack Krause, our President, and Donna Dellomo, our Chief Financial Officer, and aggregate of $115,000 of Series A-2 Preferred Stock and five-year warrants, as amended, to purchase an aggregate of 4,025 shares of common stock at an exercise price equal to the price per share of this offering, subject to adjustments.
In December 2017, the Company completed a financing transaction with Mistral Sac Holdings 4, LLC, an investment vehicle affiliated with Mistral. As part of the transaction, the Company received $2.12 million in cash in exchange for 212,000 shares of Series A-2 Preferred Stock and five-year warrants, as amended, to purchase 74,000 shares of common stock at an exercise price equal to the price per share of this offering, subject to adjustments.
Pursuant to the amended letter agreement between the Company and Satori, the Company issued to Satori 50,000 shares of common stock on June 22, 2018.
The securities issued in the above described transactions were not registered under the Securities Act of 1933, as amended, or the securities laws of any state, and were offered and sold pursuant to the exemption from registration under the Securities Act of 1933, as amended, provided by Section 4(a)(2) of the Securities Act of 1933, as amended, and Rule 506 of Regulation D thereunder. The recipients of securities in each of these transactions acquired the securities for investment only and not with a view to or for sale in connection with any distribution thereof and appropriate legends were affixed to the securities issued in these transactions. Each of the recipients of securities in these transactions was an accredited investor.
Issuance of Common Stock and Restricted Stock Units
From October 2017 to January 2019, we issued 588,799 restricted stock units (RSUs) to certain of our executive officers and employees to be settled in shares of our common stock under our Equity Plan.
On January 31, 2019, we issued 68,365 shares of common stock to certain executive officers and employees as settlement of previously granted RSUs that vested.
On March 22, 2019, we issued 279,325 shares of common stock to certain of our executive officers as settlement of previously granted RSUs that vested according to the accelerated vesting trigger in each executive officer’s respective restricted stock unit agreements.
The offers, sales, and issuances of the securities described in the preceding paragraphs were deemed to be exempt from registration either under Rule 701 promulgated under the Securities Act (Rule 701) in that the transactions were under compensatory benefit plans and contracts relating to compensation, or under Section 4(a)(2) of the Securities Act in that the transactions were between an issuer and members of its senior executive management and employees and did not involve any public offering within the meaning of Section 4(a)(2). The recipients of such securities were our employees and received the securities under our equity incentive plans. Appropriate legends were affixed to the securities issued in these transactions.
II-2
Item 16. Exhibits and Financial Statement Schedules.
(a) Exhibits
The following exhibits are filed as part of this registration statement:
| * | To be filed by amendment |
| ± | Indicates a management contract or compensatory plan. |
II-3
(b) Financial Statement Schedules
See index to financial statements on page F-1. All schedules have been omitted because they are not required or are not applicable.
Item 17. Undertakings.
The undersigned registrant hereby undertakes:
| 1. | That, for purposes of determining any liability under the Securities Act of 1933, the information omitted from the form of prospectus filed as part of this registration statement in reliance upon Rule 430A and contained in a form of prospectus filed by the registrant pursuant to Rule 424(b)(1) or (4) or 497(h) under the Securities Act shall be deemed to be part of this registration statement as of the time it was declared effective. |
| 2. | That, for the purpose of determining any liability under the Securities Act of 1933, each post-effective amendment that contains a form of prospectus shall be deemed to be a new registration statement relating to the securities offered therein, and the offering of such securities at that time shall be deemed to be the initial bona fide offering thereof. |
Insofar as indemnification for liabilities arising under the Securities Act of 1933 may be permitted to directors, officers and controlling persons of the registrant pursuant to the foregoing provisions, or otherwise, the registrant has been advised that in the opinion of the Securities and Exchange Commission such indemnification is against public policy as expressed in the Securities Act of 1933 and is, therefore, unenforceable. In the event that a claim for indemnification against such liabilities (other than the payment by the registrant of expenses incurred or paid by a director, officer or controlling person of the registrant in the successful defense of any action, suit or proceeding) is asserted by such director, officer or controlling person in connection with the securities being registered, the registrant will, unless in the opinion of its counsel the matter has been settled by controlling precedent, submit to a court of appropriate jurisdiction the question whether such indemnification by it is against public policy as expressed in the Securities Act of 1933 and will be governed by the final adjudication of such issue.
II-4
SIGNATURES
Pursuant to the requirements of the Securities Act of 1933, the registrant has duly caused this amendment to the registration statement to be signed on its behalf by the undersigned, thereunto duly authorized in the City of Stamford in the State of Connecticut, United States of America on [●], 2019.
| THE LOVESAC COMPANY | ||
| By: | ||
| Shawn Nelson | ||
| Chief Executive Officer | ||
| (Principal Executive Officer) | ||
Pursuant to the requirements of the Securities Act, this registration statement has been signed below by the following persons in the capacities and on the dates indicated.
| [●], 2019 | |||
| Shawn Nelson | |||
| Chief Executive Officer and Director | |||
| (Principal Executive Officer) | |||
| [●], 2019 | |||
| Donna Dellomo | |||
| Executive Vice President and Chief Financial Officer | |||
| (Principal Financial Officer and Principal Accounting Officer) |
|||
| [●], 2019 | |||
| Jack Krause | |||
| President and Chief Operating Officer | |||
| [●], 2019 | |||
| Andrew Heyer | |||
| Chairman and Director | |||
| [●], 2019 | |||
| David Yarnell | |||
| Director | |||
| [●], 2019 | |||
| William Phoenix | |||
| Director | |||
| [●], 2019 | |||
| Jared Rubin | |||
| Director | |||
| [●], 2019 | |||
| Christopher Bradley | |||
| Director | |||
| [●], 2019 | |||
| John Grafer | |||
| Director |
II-5