Exhibit 99.2
Investor Presentation January 2020
2 This presentation by The Lovesac Company (the “Company,” “we,” “us,” and “our”) may include “forward - looking statements” with the meaning of Section 27 A of the U . S . Securities Act of 1933 , as amended, and Section 21 E of the U . S . Exchange Act of 1934 , as amended . All forward - looking statements are subject to a number of risks, uncertainties and assumptions, and you should not rely upon forward - looking statements as predictions of future events . You can identify forward - looking statements by words such as “anticipate,” “believe,” “could,” “estimate,” “expect,” “intend,” “may,” “plan,” “potential,” “predict,” “project,” “should,” “would” or the negative of those terms, and similar expressions that convey uncertainty of future events or outcomes . All forward - looking statements will be based upon current estimates and expectations about future events and financial and other trends . There is no guarantee that future results, performance or events reflected in the forward - looking statements will be achieved or occur . No person assumes responsibility for the accuracy and completeness of the forward - looking statements, and, except as required by law, no person undertakes any obligation to update any forward - looking statements for any reason after the date of this company presentation . Certain data in this presentation was obtained from various external sources . Neither the Company nor its affiliates, advisers or representatives have verified such data with independent sources . Accordingly, neither the Company nor any of its affiliates, advisers or representatives make any representations as to the accuracy or completeness of that data or to update such data after the date of this presentation . Such data involves risks and uncertainties and is subject to change based on various factors . Use of Non - GAAP Information This presentation contains numbers that are not required by, or presented in accordance with, GAAP , including EBITDA, Adjusted EBITDA, and Adjusted EBITDA Margin (collectively, our “Non - GAAP Measures ”) . Our Non - GAAP Measures are not GAAP measures of our financial performance or liquidity and should not be considered as alternatives to net income (loss) or net income (loss) per share as a measure of financial performance, cash flows from operating activities as a measure of liquidity, or any other performance measure derived in accordance with GAAP . They should not be construed as an inference that our future results will be unaffected by unusual or non - recurring items . Additionally, our Non - GAAP Measures are not intended to be measures of free cash flow for management’s discretionary use, as they do not consider certain cash requirements such as tax payments and debt service requirements and certain other cash costs that may recur in the future . Our Non - GAAP Measures contain certain other limitations, including the failure to reflect our cash expenditures, cash requirements for working capital needs and cash costs to replace assets being depreciated and amortized . In addition, our Non - GAAP Measures exclude certain non - recurring and other charges . You should be aware that in the future we may incur expenses that are the same as or similar to some of the adjustments in Our Non - GAAP Measures . Our presentation of Our Non - GAAP Measures should not be construed to imply that our future results will be unaffected by any such adjustments . Management compensates for these limitations by relying primarily on our GAAP results and by using our Non - GAAP Measures as supplemental information . Our Non - GAAP Measures are not necessarily comparable to other similarly titled captions of other companies due to different methods of calculation . A reconciliation of some of our Non - GAAP Measures to the nearest comparable GAAP measure can be found at slide 31 of this presentation . Safe Harbor Statement
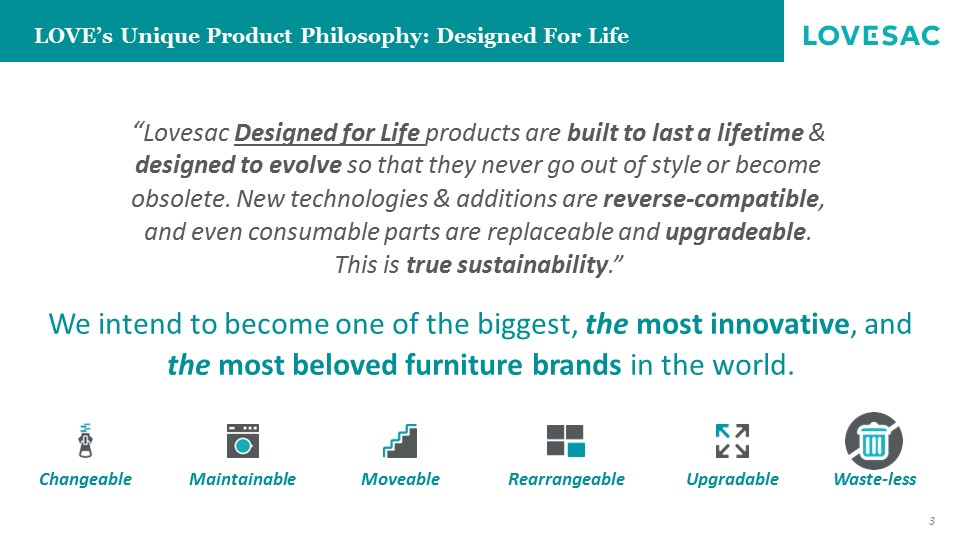
3 LOVE’s Unique Product Philosophy: Designed For Life Waste - less Changeable Maintainable Rearrangeable Upgradable Moveable “ Lovesac Designed for Life products are built to last a lifetime & designed to evolve so that they never go out of style or become obsolete. New technologies & additions are reverse - compatible , and even consumable parts are replaceable and upgradeable . This is true sustainability .” We intend to become one of the biggest, the most innovative , and the most beloved furniture brands in the world.
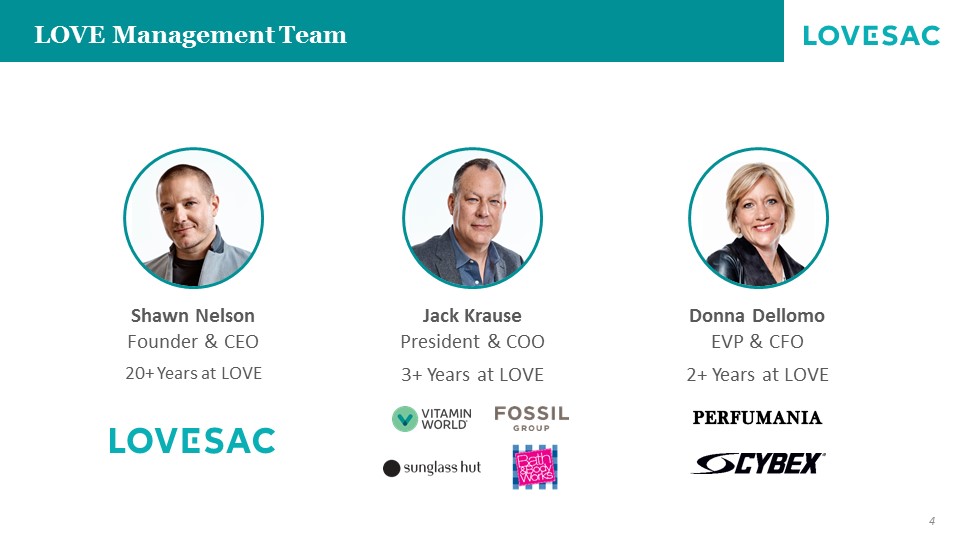
LOVE Management Team Shawn Nelson Founder & CEO 20+ Years at LOVE Jack Krause President & COO 3+ Years at LOVE Donna Dellomo EVP & CFO 2+ Years at LOVE 4
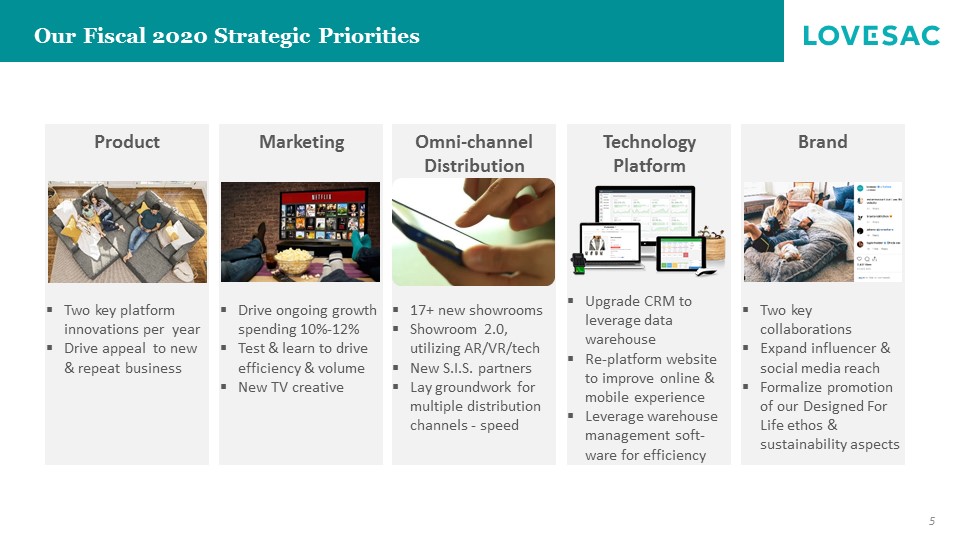
5 Our Fiscal 2020 Strategic Priorities Product Marketing Omni - channel Distribution Technology Platform Brand ▪ Two key platform innovations per year ▪ Drive appeal to new & repeat business ▪ Drive ongoing growth spending 10% - 12% ▪ Test & learn to drive efficiency & volume ▪ New TV creative ▪ 17+ new showrooms ▪ Showroom 2.0, utilizing AR/VR/tech ▪ New S.I.S. partners ▪ Lay groundwork for multiple distribution channels - speed ▪ Upgrade CRM to leverage data warehouse ▪ Re - platform website to improve online & mobile experience ▪ Leverage warehouse management soft - ware for efficiency ▪ Two key collaborations ▪ Expand influencer & social media reach ▪ Formalize promotion of our Designed For Life ethos & sustainability aspects
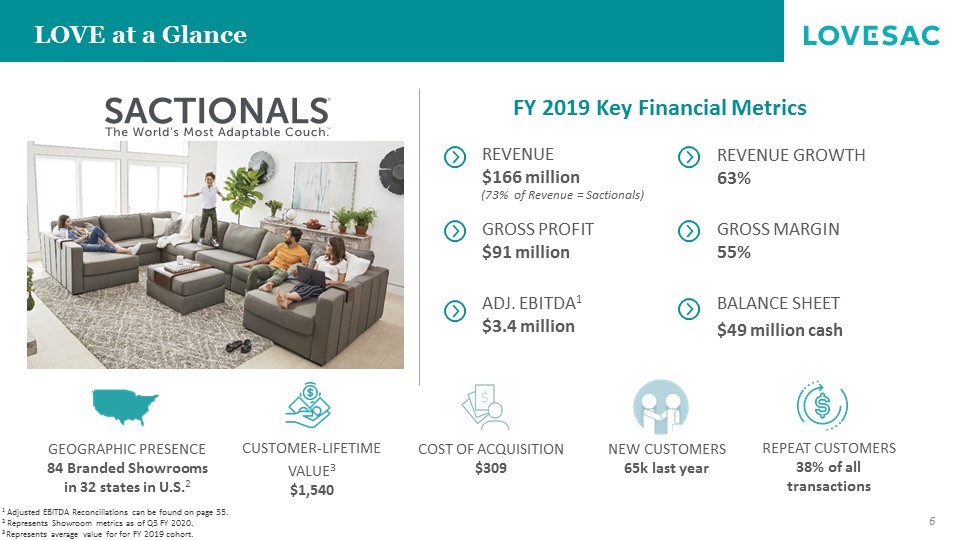
LOVE at a Glance CUSTOMER - LIFETIME VALUE 3 $1,540 GEOGRAPHIC PRESENCE 84 Branded Showrooms in 32 states in U.S. 2 REPEAT CUSTOMERS 38% of all transactions 6 1 Adjusted EBITDA Reconciliations can be found on page 35. 2 Represents Showroom metrics as of Q3 FY 2020. 3 Represents average value for for FY 2019 cohort. FY 2019 Key Financial Metrics REVENUE $166 million REVENUE GROWTH 63% GROSS MARGIN 55% GROSS PROFIT $91 million ADJ. EBITDA 1 $3.4 million BALANCE SHEET $49 million cash COST OF ACQUISITION $309 NEW CUSTOMERS 65k last year (73% of Revenue = Sactionals)
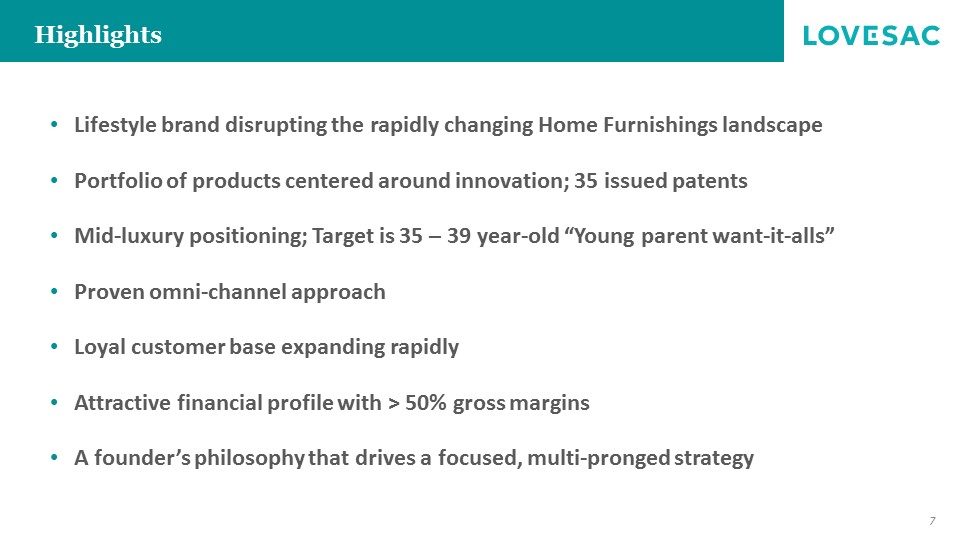
Highlights • Lifestyle brand disrupting the rapidly changing Home Furnishings landscape • Portfolio of products centered around innovation ; 35 issued patents • Mid - luxury positioning ; Target is 35 – 39 year - old “Young parent want - it - alls ” • Proven omni - channel approach • Loyal customer base expanding rapidly • Attractive financial profile with > 50 % gross margins • A founder’s philosophy that drives a focused, multi - pronged strategy 7
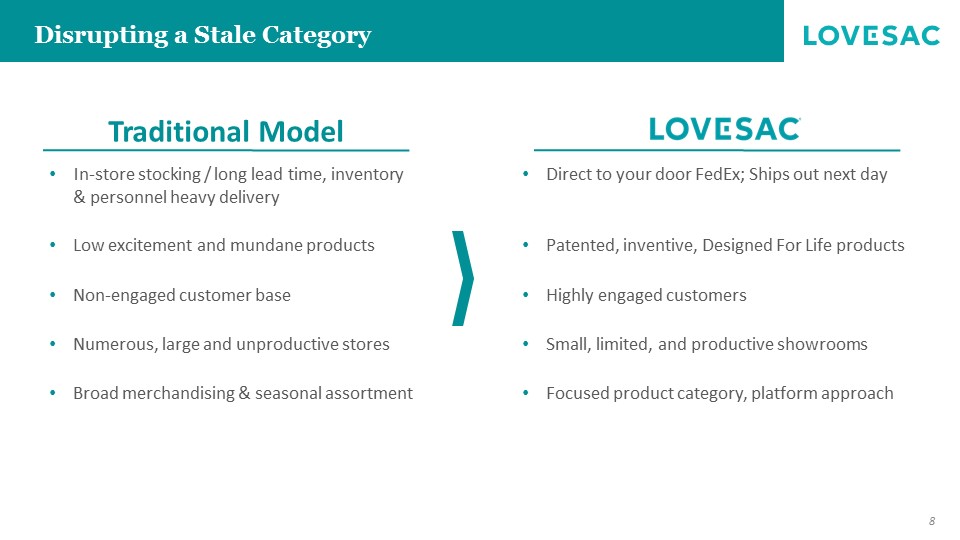
Disrupting a Stale Category • Low excitement and mundane products • Patented, inventive, Designed For Life products • In - store stocking / long lead time, inventory & personnel heavy delivery • Direct to your door FedEx; Ships out next day • Non - engaged customer base • Highly engaged customers • Numerous, large and unproductive stores • Small, limited, and productive showrooms • Broad merchandising & seasonal assortment • Focused product category, platform approach 8 Traditional Model
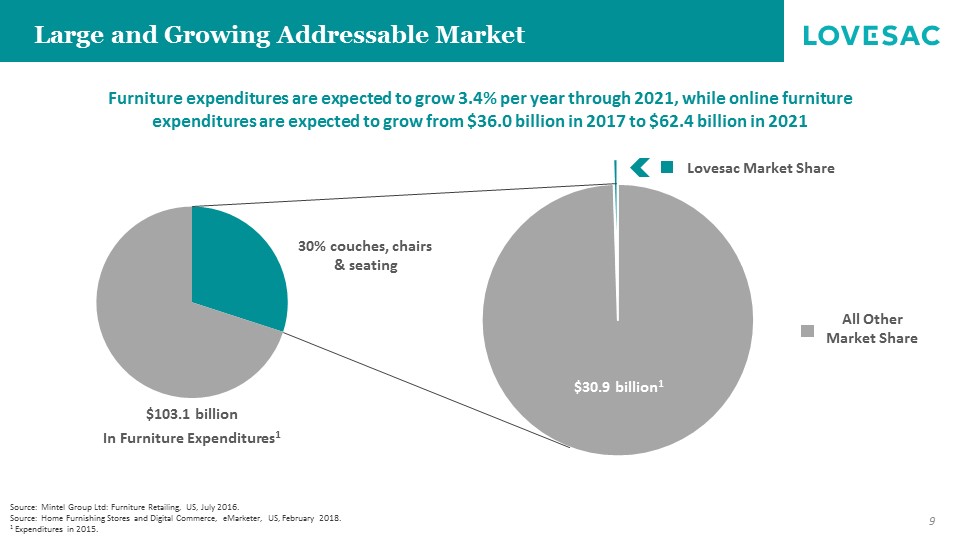
Large and Growing Addressable Market All Other Market Share Lovesac Market Share Source: Mintel Group Ltd: Furniture Retailing, US, July 2016. Source: Home Furnishing Stores and Digital Commerce, eMarketer, US, February 2018. 1 Expenditures in 2015. In Furniture Expenditures 1 $103.1 billion 30% couches, chairs & seating Furniture expenditures are expected to grow 3.4% per year through 2021, while online furniture expenditures are expected to grow from $36.0 billion in 2017 to $62.4 billion in 2021 $30.9 billion 1 9
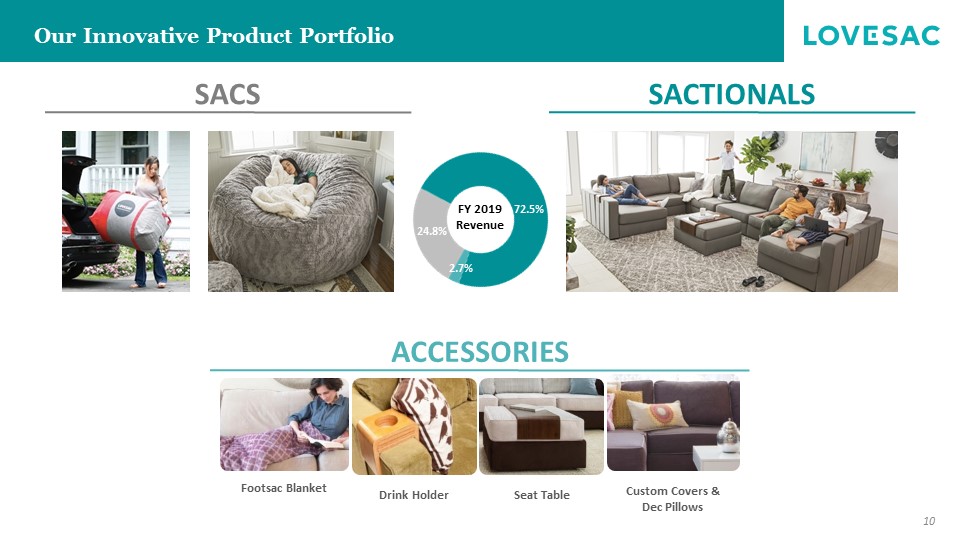
SACTIONALS SACS 10 Our Innovative Product Portfolio FY 2019 Revenue 72.5% 24.8% 2.7% ACCESSORIES Seat Table Drink Holder Footsac Blanket Custom Covers & Dec Pillows
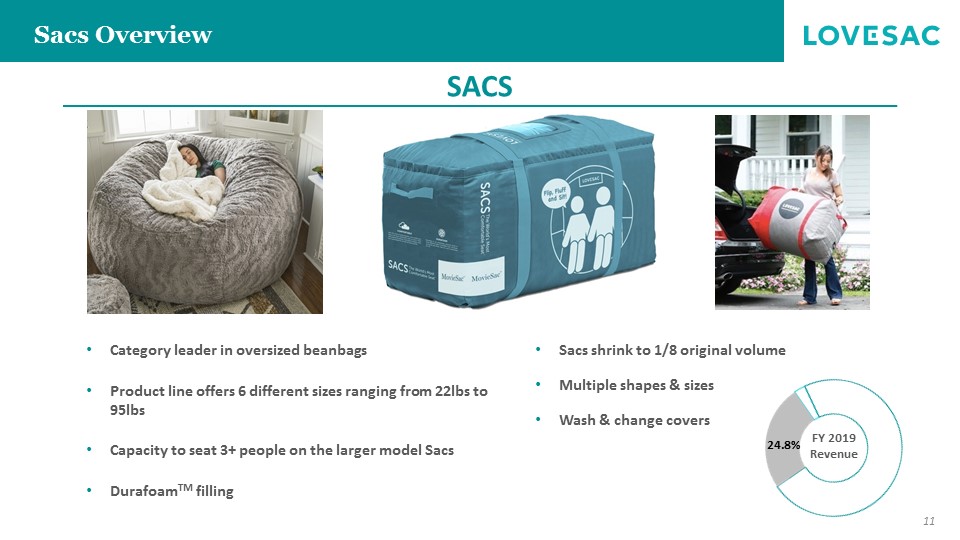
Sacs Overview 11 FY 2019 Revenue 24.8% SACS • Sacs shrink to 1/8 original volume • Multiple shapes & sizes • Wash & change covers • Category leader in oversized beanbags • Product line offers 6 different sizes ranging from 22lbs to 95lbs • Capacity to seat 3+ people on the larger model Sacs • Durafoam TM filling
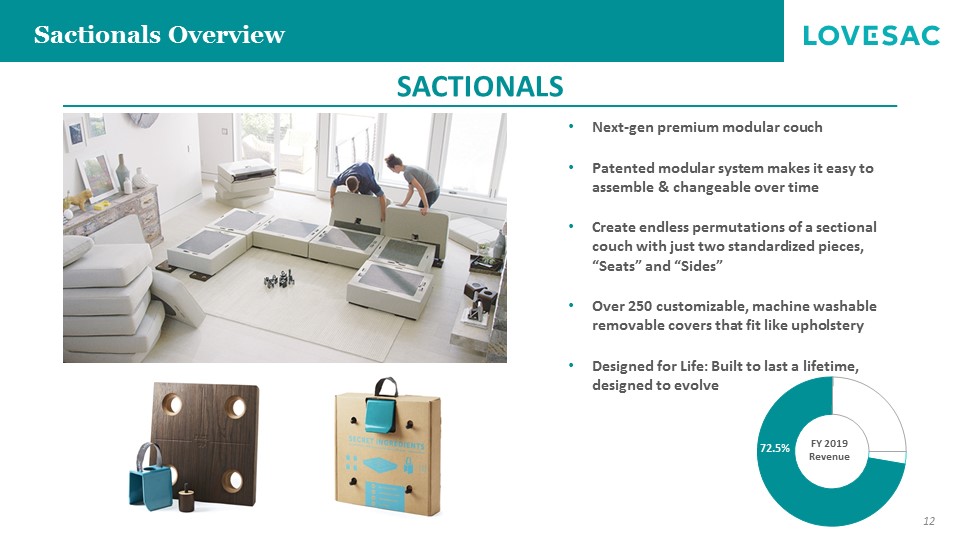
Sactionals Overview • Next - gen premium modular couch • Patented modular system makes it easy to assemble & changeable over time • Create endless permutations of a sectional couch with just two standardized pieces, “Seats” and “Sides” • Over 250 customizable, machine washable removable covers that fit like upholstery • Designed for Life: Built to last a lifetime, designed to evolve SACTIONALS 12 FY 2019 Revenue 72.5%
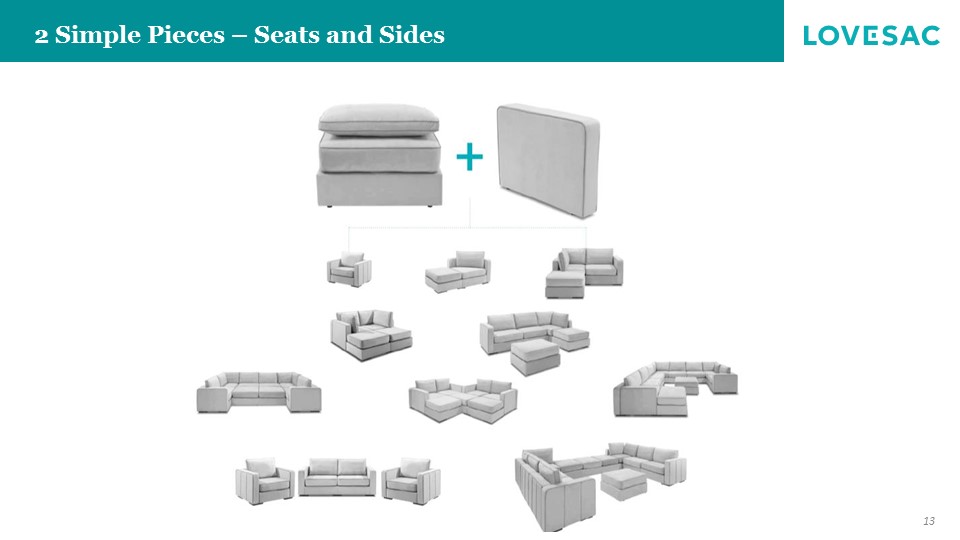
2 Simple Pieces – Seats and Sides 13
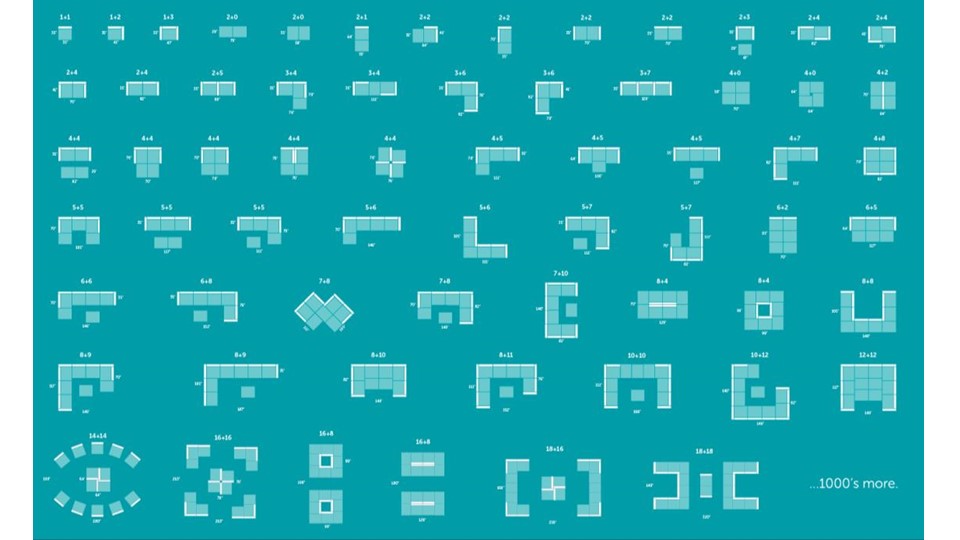
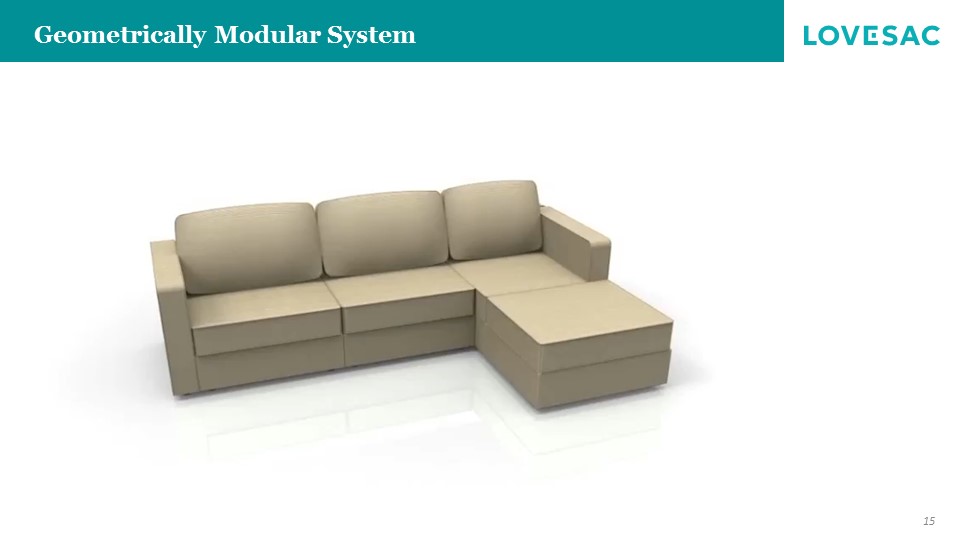
Confidential Geometrically Modular System 15
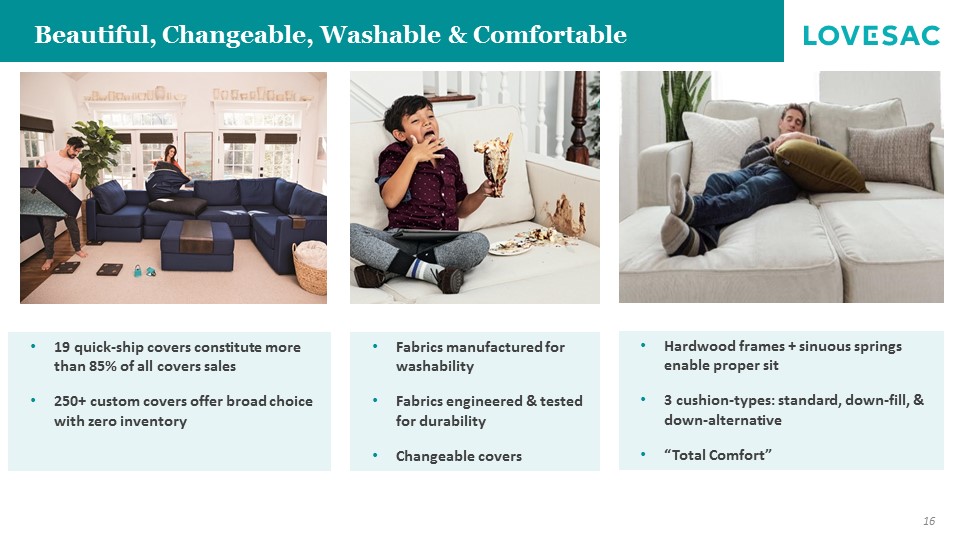
Beautiful, Changeable, Washable & Comfortable • 19 quick - ship covers constitute more than 85% of all covers sales • 250+ custom covers offer broad choice with zero inventory • Fabrics manufactured for washability • Fabrics engineered & tested for durability • Changeable covers • Hardwood frames + sinuous springs enable proper sit • 3 cushion - types: standard, down - fill, & down - alternative • “Total Comfort” 16
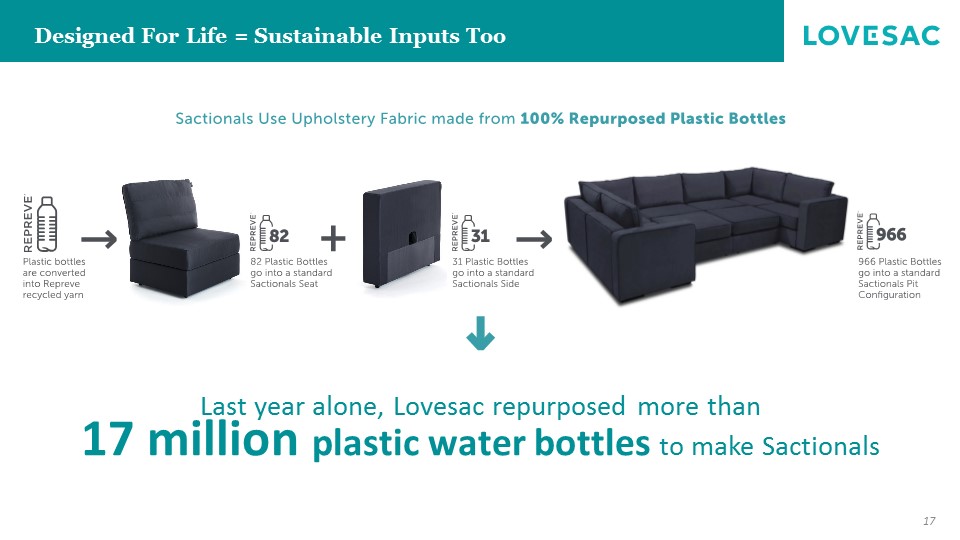
17 Designed For Life = Sustainable Inputs Too Last year alone, Lovesac repurposed more than 17 million plastic water bottles to make Sactionals
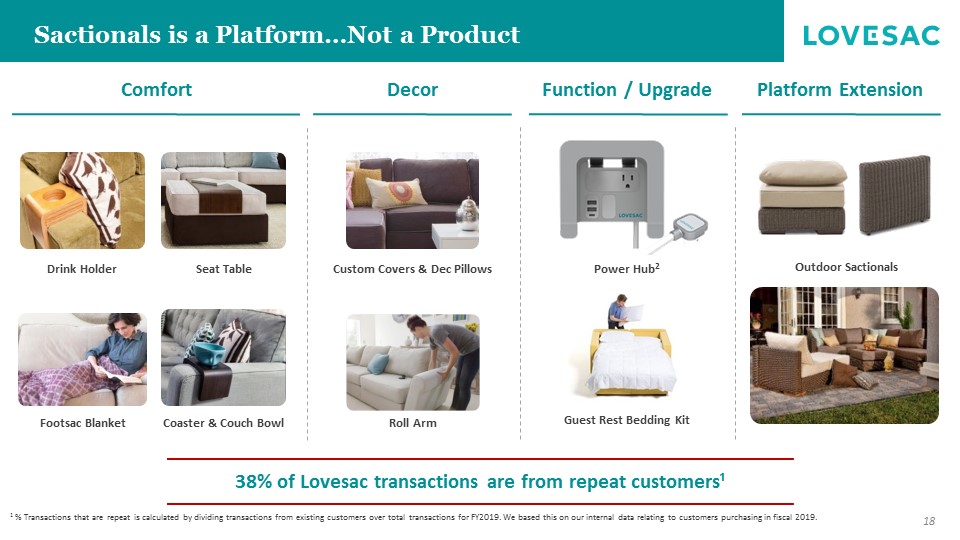
38% of Lovesac transactions are from repeat customers¹ Sactionals is a Platform …Not a Product 1 % Transactions that are repeat is calculated by dividing transactions from existing customers over total transactions for FY2 01 9. We based this on our internal data relating to customers purchasing in fiscal 2019 . Coaster & Couch Bowl Seat Table Drink Holder Footsac Blanket Outdoor Sactionals Custom Covers & Dec Pillows Roll Arm Power Hub 2 Guest Rest Bedding Kit 18 Comfort Decor Function / Upgrade Platform Extension
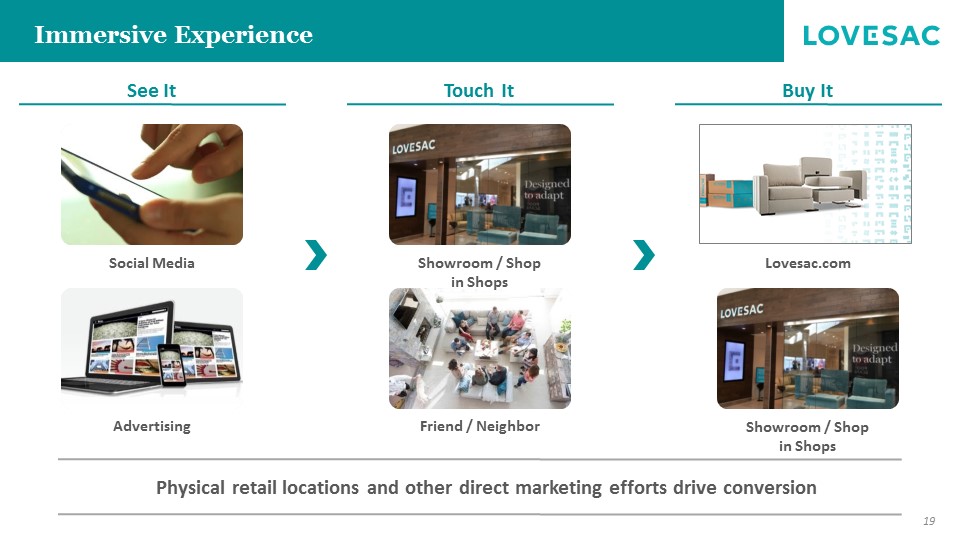
Buy It Immersive Experience Friend / Neighbor Showroom / Shop in Shops Lovesac.com Social Media Advertising 19 Physical retail locations and other direct marketing efforts drive conversion See It Touch It Showroom / Shop in Shops
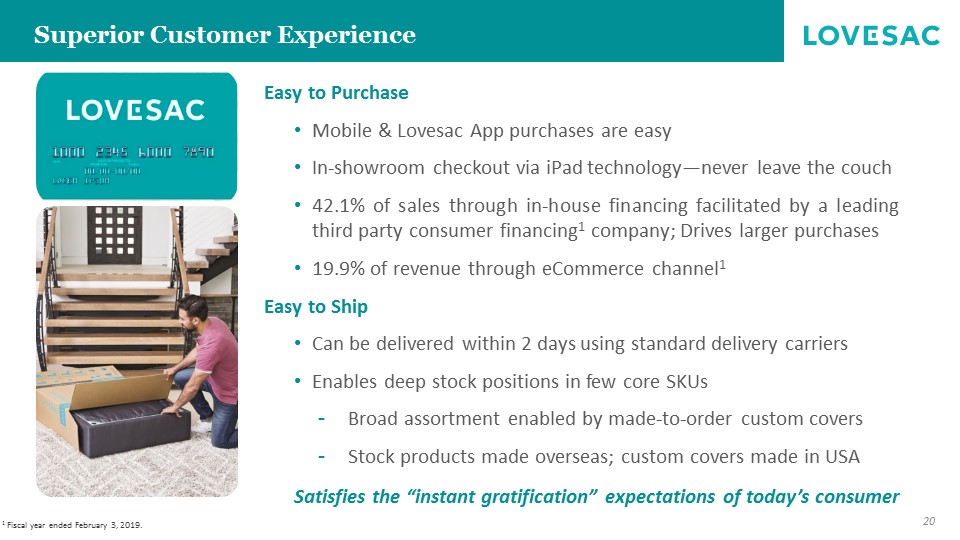
Superior Customer Experience Easy to Purchase • Mobile & Lovesac App purchases are easy • In - showroom checkout via iPad technology — never leave the couch • 42 . 1 % of sales through in - house financing facilitated by a leading third party consumer financing 1 company ; Drives larger purchases • 19 . 9 % of revenue through eCommerce channel 1 Easy to Ship • Can be delivered within 2 days using standard delivery carriers • Enables deep stock positions in few core SKUs - Broad assortment enabled by made - to - order custom covers - Stock products made overseas ; custom covers made in USA Satisfies the “instant gratification” expectations of today’s consumer 20 1 Fiscal year ended February 3, 2019.
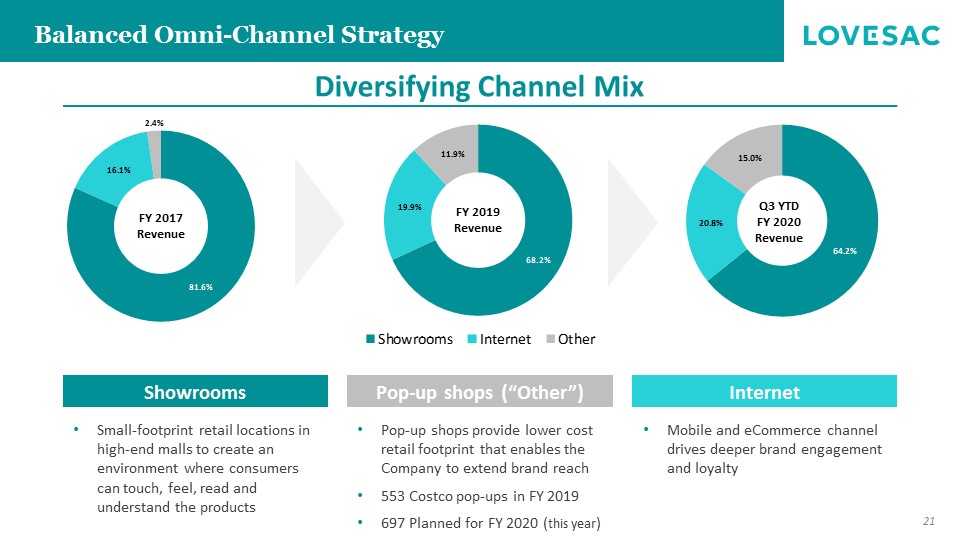
64.2% 20.8% 15.0% 21 Balanced Omni - Channel Strategy Diversifying Channel Mix 81.6% 16.1% 2.4% FY 2017 Revenue 68.2% 19.9% 11.9% FY 2019 Revenue 68.2% 19.9% 11.9% Showrooms Internet Other Showrooms • Small - footprint retail locations in high - end malls to create an environment where consumers can touch, feel, read and understand the products Internet • Mobile and eCommerce channel drives deeper brand engagement and loyalty Pop - up shops (“Other”) • Pop - up shops provide lower cost retail footprint that enables the Company to extend brand reach • 553 Costco pop - ups in FY 2019 • 697 Planned for FY 2020 ( this year ) Q3 YTD FY 2020 Revenue
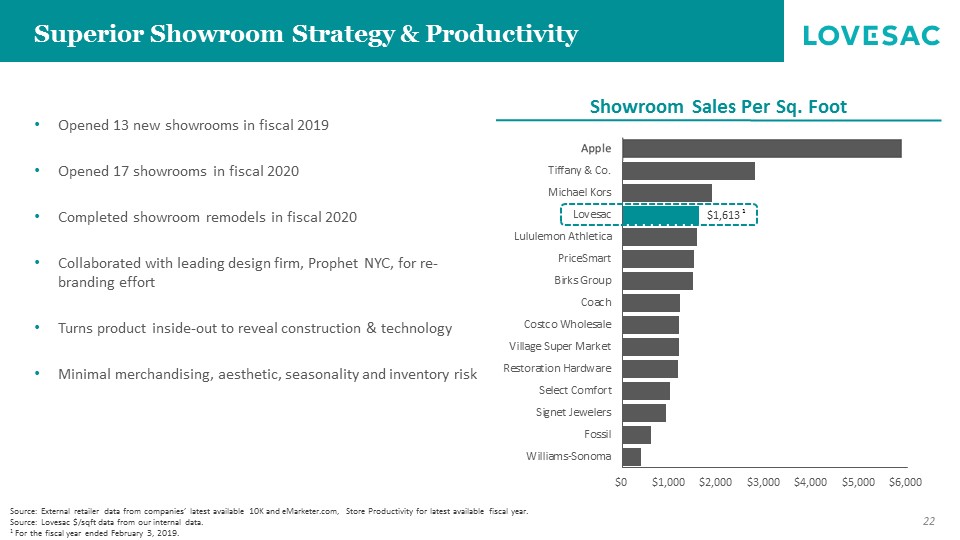
• Opened 13 new showrooms in fiscal 2019 • Opened 17 showrooms in fiscal 2020 • Completed showroom remodels in fiscal 2020 • Collaborated with leading design firm, Prophet NYC, for re - branding effort • Turns product inside - out to reveal construction & technology • Minimal merchandising, aesthetic, seasonality and inventory risk Source: External retailer data from companies’ latest available 10K and eMarketer.com, Store Productivity for latest availabl e f iscal year. Source: Lovesac $/sqft data from our internal data. 1 For the fiscal year ended February 3, 2019. Superior Showroom Strategy & Productivity 22 $1,613 $0 $1,000 $2,000 $3,000 $4,000 $5,000 $6,000 Williams-Sonoma Fossil Signet Jewelers Select Comfort Restoration Hardware Village Super Market Costco Wholesale Coach Birks Group PriceSmart Lululemon Athletica Lovesac Michael Kors Tiffany & Co. Murphy USA Apple 1 Showroom Sales Per Sq. Foot

23 Attractive New Showroom Model • Opened 17 new showrooms in FY 20 or 20 % year - over - year growth • Economics of new showroom model are favorable with strong returns on investment : • Target net sales of $ 1 . 5 to $ 1 . 6 million in the first year • Positive four - wall Adjusted EBITDA in the first year • Net Investments – incl . floor model inventory, Capex and preopening expenses = $ 365 K • The average payback of our showroom investments is under two years* • Expect to open 20 new showrooms in FY 21 or 18 % year - over - year growth *Payback period defined as, for given showroom, starting with the first day it is open, the date on which cumulative four wal l A djusted EBITDA before start up expense for the showroom equals total net investment cost for that showroom
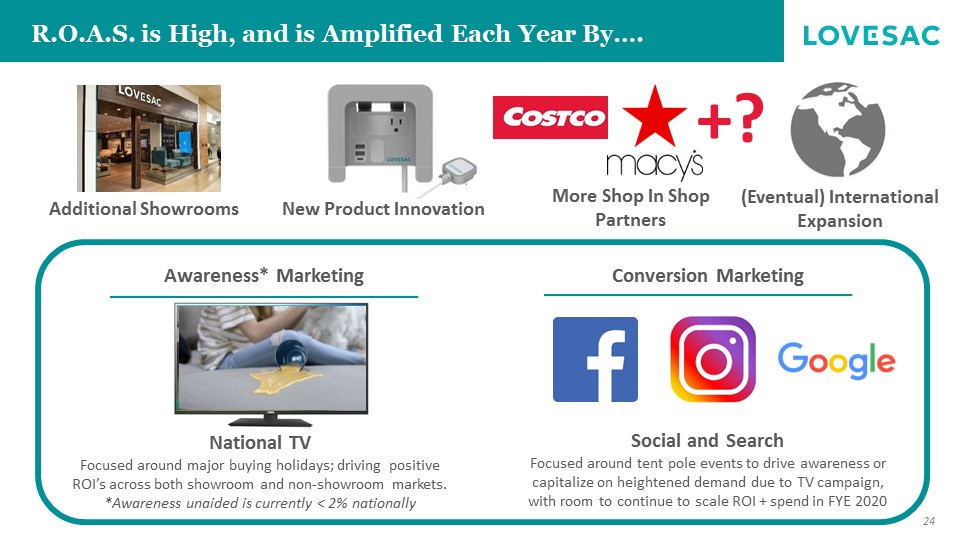
Conversion Marketing Awareness* Marketing 24 R.O.A.S. is High, and is Amplified Each Year By…. National TV Focused around major buying holidays; driving positive ROI’s across both showroom and non - showroom markets. *Awareness unaided is currently < 2% nationally Social and Search Focused around tent pole events to drive awareness or capitalize on heightened demand due to TV campaign, with room to continue to scale ROI + spend in FYE 2020 Additional Showrooms New Product Innovation More Shop In Shop Partners (Eventual) International Expansion +?
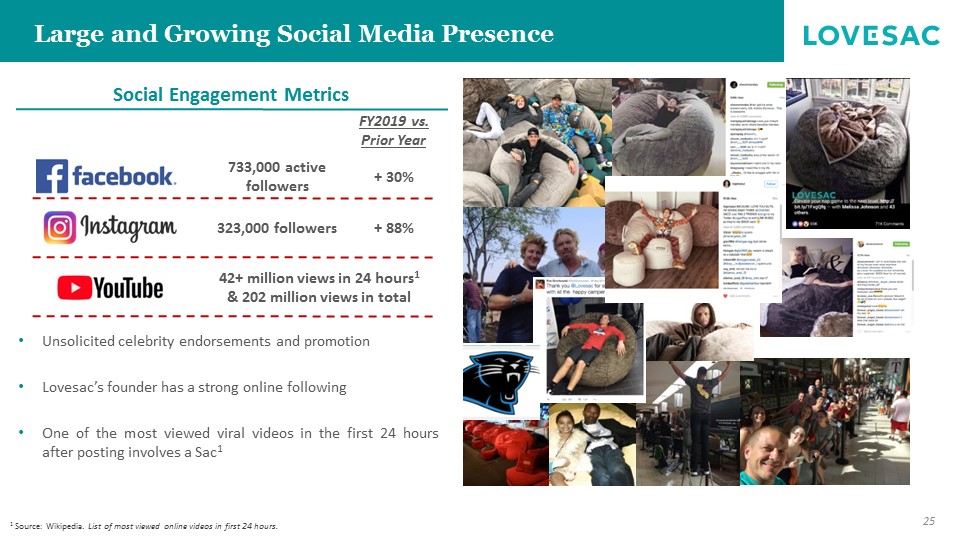
• Unsolicited celebrity endorsements and promotion • Lovesac’s founder has a strong online following • One of the most viewed viral videos in the first 24 hours after posting involves a Sac 1 1 Source: Wikipedia. List of most viewed online videos in first 24 hours. FY2019 vs. Prior Year + 30% 733,000 active followers + 88% 323,000 followers 42+ million views in 24 hours 1 & 202 million views in total Large and Growing Social Media Presence 25 Social Engagement Metrics
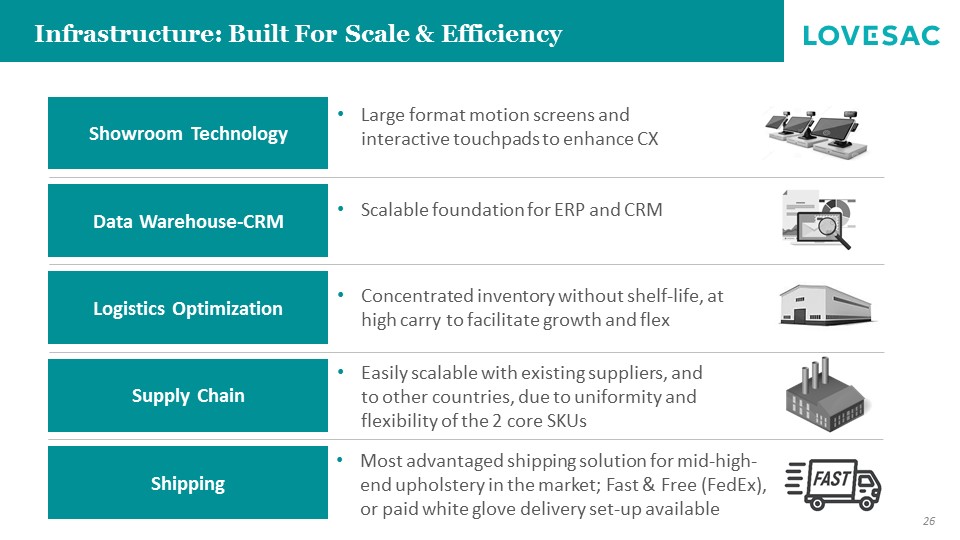
Showroom Technology Data Warehouse - CRM Logistics Optimization Supply Chain • Large format motion screens and interactive touchpads to enhance CX • Scalable foundation for ERP and CRM • Concentrated inventory without shelf - life, at high carry to facilitate growth and flex • Easily scalable with existing suppliers, and to other countries, due to uniformity and flexibility of the 2 core SKUs Infrastructure: Built For Scale & Efficiency 26 Shipping • Most advantaged shipping solution for mid - high - end upholstery in the market; Fast & Free (FedEx), or paid white glove delivery set - up available
Summary • Large TAM : Significant opportunity to disrupt a huge, and transitioning home furnishing market • Unique Product : Products are shippable, durable, washable and easily changeable with a focus on sustainability given our Designed For Life philosophy • Patent Portfolio : Patent portfolio helps drive differentiation • Product Innovation : Brand and portfolio of products, including new product introductions, centered around innovation • Disruptive Omni - channel Approach : Multi - channel distribution through showrooms, shop in shops and online, expands brand reach and drives customer engagement 27

Financials
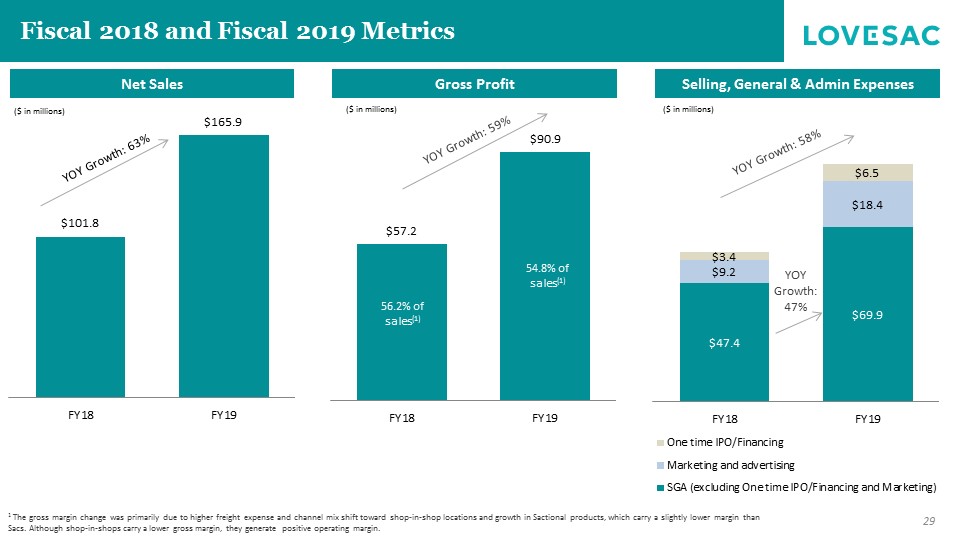
$101.8 $165.9 FY18 FY19 $57.2 $90.9 FY18 FY19 Net Sales Gross Profit Selling, General & Admin Expenses 29 Fiscal 2018 and Fiscal 2019 Metrics 1 The gross margin change was primarily due to higher freight expense and channel mix shift toward shop - in - shop locations and growth in Sactional products , which carry a slightly lower margin than Sacs. Although shop - in - shops carry a lower gross margin, they generate positive operating margin. 56.2% of sales (1) 54.8% of sales (1) $47.4 $69.9 $9.2 $18.4 $3.4 $6.5 FY18 FY19 One time IPO/Financing Marketing and advertising SGA (excluding One time IPO/Financing and Marketing) YOY Growth: 47% ($ in millions) ($ in millions) ($ in millions)
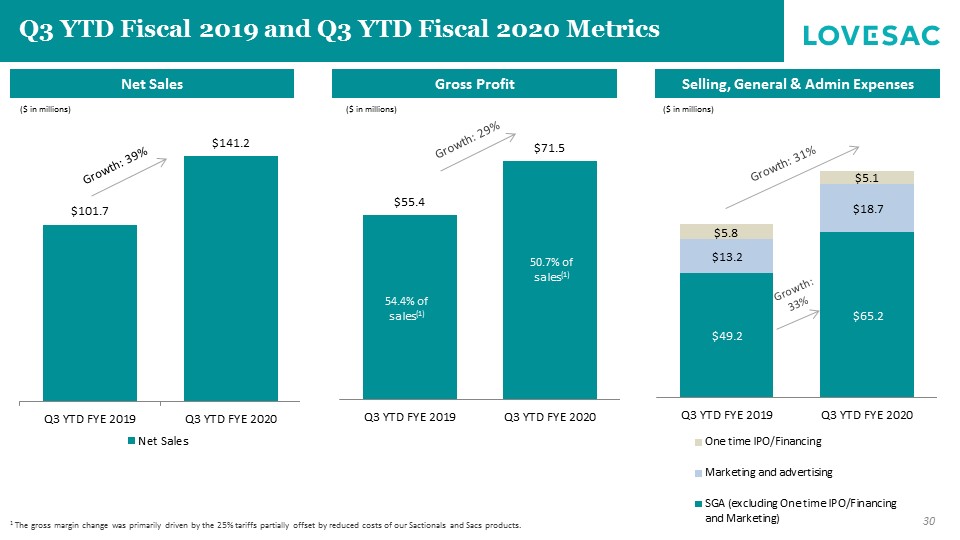
$49.2 $65.2 $13.2 $18.7 $5.8 $5.1 Q3 YTD FYE 2019 Q3 YTD FYE 2020 One time IPO/Financing Marketing and advertising SGA (excluding One time IPO/Financing and Marketing) $55.4 $71.5 Q3 YTD FYE 2019 Q3 YTD FYE 2020 Net Sales Gross Profit Selling, General & Admin Expenses 30 Q3 YTD Fiscal 2019 and Q3 YTD Fiscal 2020 Metrics 1 The gross margin change was primarily driven by the 25% tariffs partially offset by reduced costs of our Sactionals and Sacs products. 54.4% of sales (1) 50.7% of sales (1) ($ in millions) ($ in millions) ($ in millions) 76.2% Comp sales (1) 72.5% Comp sales (1) $101.7 $141.2 Q3 YTD FYE 2019 Q3 YTD FYE 2020 Net Sales
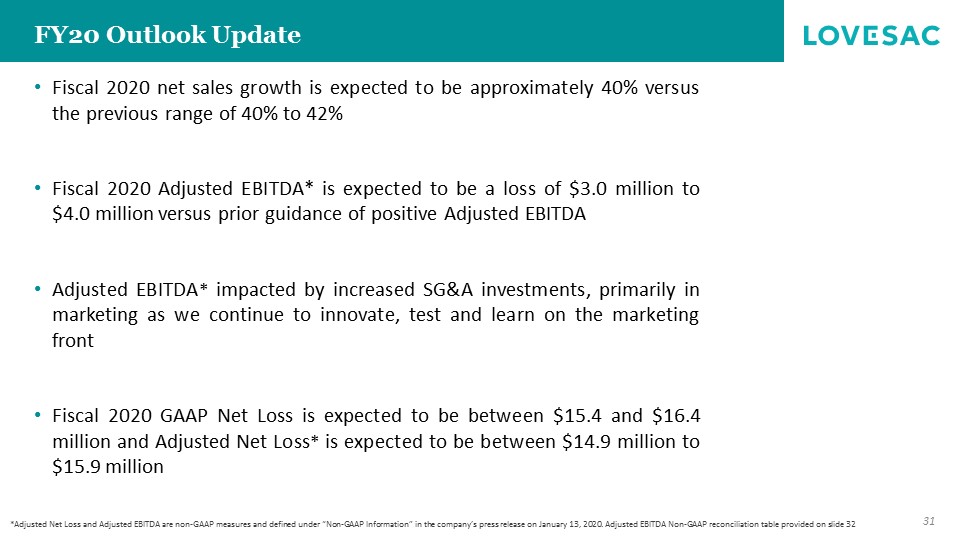
31 FY20 Outlook Update • Fiscal 2020 net sales growth is expected to be approximately 40 % versus the previous range of 40 % to 42 % • Fiscal 2020 Adjusted EBITDA * is expected to be a loss of $ 3 . 0 million to $ 4 . 0 million versus prior guidance of positive Adjusted EBITDA • Adjusted EBITDA * impacted by increased SG&A investments, primarily in marketing as we continue to innovate, test and learn on the marketing front • Fiscal 2020 GAAP Net Loss is expected to be between $ 15 . 4 and $ 16 . 4 million and Adjusted Net Loss * is expected to be between $ 14 . 9 million to $ 15 . 9 million *Adjusted Net Loss and Adjusted EBITDA are non - GAAP measures and defined under “Non - GAAP Information” in the company’s press release on January 13, 2020. Adjusted EBITDA N on - GAAP r econciliation table provided on slide 32
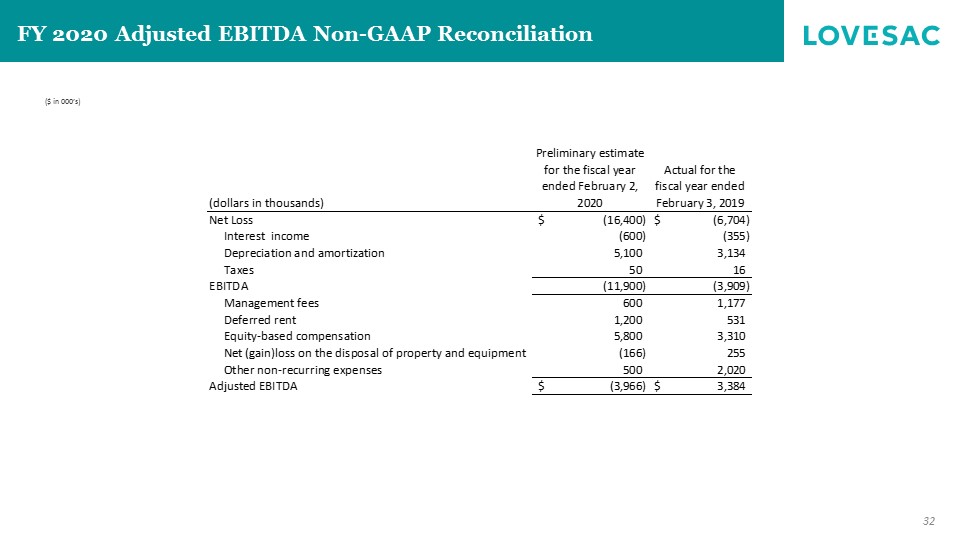
32 FY 2020 Adjusted EBITDA Non - GAAP Reconciliation ($ in 000’s) (dollars in thousands) Preliminary estimate for the fiscal year ended February 2, 2020 Actual for the fiscal year ended February 3, 2019 Net Loss (16,400)$ (6,704)$ Interest income (600) (355) Depreciation and amortization 5,100 3,134 Taxes 50 16 EBITDA (11,900) (3,909) Management fees 600 1,177 Deferred rent 1,200 531 Equity-based compensation 5,800 3,310 Net (gain)loss on the disposal of property and equipment (166) 255 Other non-recurring expenses 500 2,020 Adjusted EBITDA (3,966)$ 3,384$
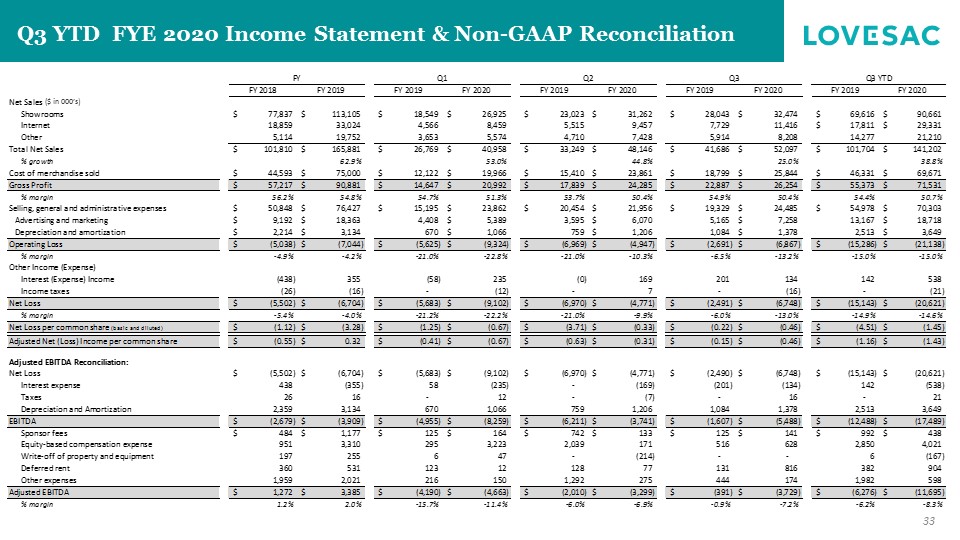
FY 2018 FY 2019 FY 2019 FY 2020 FY 2019 FY 2020 FY 2019 FY 2020 FY 2019 FY 2020 Net Sales Showrooms 77,837$ 113,105$ 18,549$ 26,925$ 23,023$ 31,262$ 28,043$ 32,474$ 69,616$ 90,661$ Internet 18,859 33,024 4,566 8,459 5,515 9,457 7,729 11,416 17,811$ 29,331$ Other 5,114 19,752 3,653 5,574 4,710 7,428 5,914 8,208 14,277 21,210 Total Net Sales 101,810$ 165,881$ 26,769$ 40,958$ 33,249$ 48,146$ 41,686$ 52,097$ 101,704$ 141,202$ % growth 62.9% 53.0% 44.8% 25.0% 38.8% Cost of merchandise sold 44,593$ 75,000$ 12,122$ 19,966$ 15,410$ 23,861$ 18,799$ 25,844$ 46,331$ 69,671$ Gross Profit 57,217$ 90,881$ 14,647$ 20,992$ 17,839$ 24,285$ 22,887$ 26,254$ 55,373$ 71,531$ % margin 56.2% 54.8% 54.7% 51.3% 53.7% 50.4% 54.9% 50.4% 54.4% 50.7% Selling, general and administrative expenses 50,848$ 76,427$ 15,195$ 23,862$ 20,454$ 21,956$ 19,329$ 24,485$ 54,978$ 70,303$ Advertising and marketing 9,192$ 18,363$ 4,408 5,389$ 3,595 6,070$ 5,165 7,258$ 13,167 18,718$ Depreciation and amortization 2,214$ 3,134$ 670 1,066$ 759 1,206$ 1,084 1,378$ 2,513 3,649$ Operating Loss (5,038)$ (7,044)$ (5,625)$ (9,324)$ (6,969)$ (4,947)$ (2,691)$ (6,867)$ (15,286)$ (21,138)$ % margin -4.9% -4.2% -21.0% -22.8% -21.0% -10.3% -6.5% -13.2% -15.0% -15.0% Other Income (Expense) Interest (Expense) Income (438) 355 (58) 235 (0) 169 201 134 142 538 Income taxes (26) (16) - (12) - 7 - (16) - (21) Net Loss (5,502)$ (6,704)$ (5,683)$ (9,102)$ (6,970)$ (4,771)$ (2,491)$ (6,748)$ (15,143)$ (20,621)$ % margin -5.4% -4.0% -21.2% -22.2% -21.0% -9.9% -6.0% -13.0% -14.9% -14.6% Net Loss per common share (basic and diluted) (1.12)$ (3.28)$ (1.25)$ (0.67)$ (3.71)$ (0.33)$ (0.22)$ (0.46)$ (4.51)$ (1.45)$ Adjusted Net (Loss) Income per common share (0.55)$ 0.32$ (0.41)$ (0.67)$ (0.63)$ (0.31)$ (0.15)$ (0.46)$ (1.16)$ (1.43)$ Adjusted EBITDA Reconciliation: Net Loss (5,502)$ (6,704)$ (5,683)$ (9,102)$ (6,970)$ (4,771)$ (2,490)$ (6,748)$ (15,143)$ (20,621)$ Interest expense 438 (355) 58 (235) - (169) (201) (134) 142 (538) Taxes 26 16 - 12 - (7) - 16 - 21 Depreciation and Amortization 2,359 3,134 670 1,066 759 1,206 1,084 1,378 2,513 3,649 EBITDA (2,679)$ (3,909)$ (4,955)$ (8,259)$ (6,211)$ (3,741)$ (1,607)$ (5,488)$ (12,488)$ (17,489)$ Sponsor fees 484$ 1,177$ 125$ 164$ 742$ 133$ 125$ 141$ 992$ 438$ Equity-based compensation expense 951 3,310 295 3,223 2,039 171 516 628 2,850 4,021 Write-off of property and equipment 197 255 6 47 - (214) - - 6 (167) Deferred rent 360 531 123 12 128 77 131 816 382 904 Other expenses 1,959 2,021 216 150 1,292 275 444 174 1,982 598 Adjusted EBITDA 1,272$ 3,385$ (4,190)$ (4,663)$ (2,010)$ (3,299)$ (391)$ (3,729)$ (6,276)$ (11,695)$ % margin 1.2% 2.0% -15.7% -11.4% -6.0% -6.9% -0.9% -7.2% -6.2% -8.3% Q3 YTDQ3Q1FY Q2 33 Q3 YTD FYE 2020 Income Statement & Non - GAAP Reconciliation ($ in 000’s)

Appendix
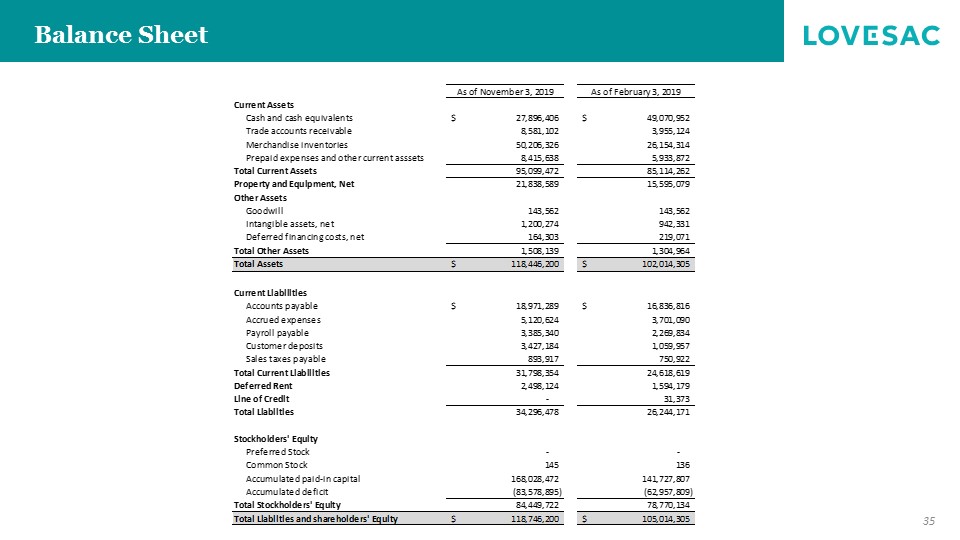
35 Balance Sheet As of November 3, 2019 As of February 3, 2019 Current Assets Cash and cash equivalents 27,896,406$ 49,070,952$ Trade accounts receivable 8,581,102 3,955,124 Merchandise inventories 50,206,326 26,154,314 Prepaid expenses and other current asssets 8,415,638 5,933,872 Total Current Assets 95,099,472 85,114,262 Property and Equipment, Net 21,838,589 15,595,079 Other Assets Goodwill 143,562 143,562 Intangible assets, net 1,200,274 942,331 Deferred financing costs, net 164,303 219,071 Total Other Assets 1,508,139 1,304,964 Total Assets 118,446,200$ 102,014,305$ Current Liabilities Accounts payable 18,971,289$ 16,836,816$ Accrued expenses 5,120,624 3,701,090 Payroll payable 3,385,340 2,269,834 Customer deposits 3,427,184 1,059,957 Sales taxes payable 893,917 750,922 Total Current Liabilities 31,798,354 24,618,619 Deferred Rent 2,498,124 1,594,179 Line of Credit - 31,373 Total Liabilties 34,296,478 26,244,171 Stockholders' Equity Preferred Stock - - Common Stock 145 136 Accumulated paid-in capital 168,028,472 141,727,807 Accumulated deficit (83,578,895) (62,957,809) Total Stockholders' Equity 84,449,722 78,770,134 Total Liabilties and shareholders' Equity 118,746,200$ 105,014,305$
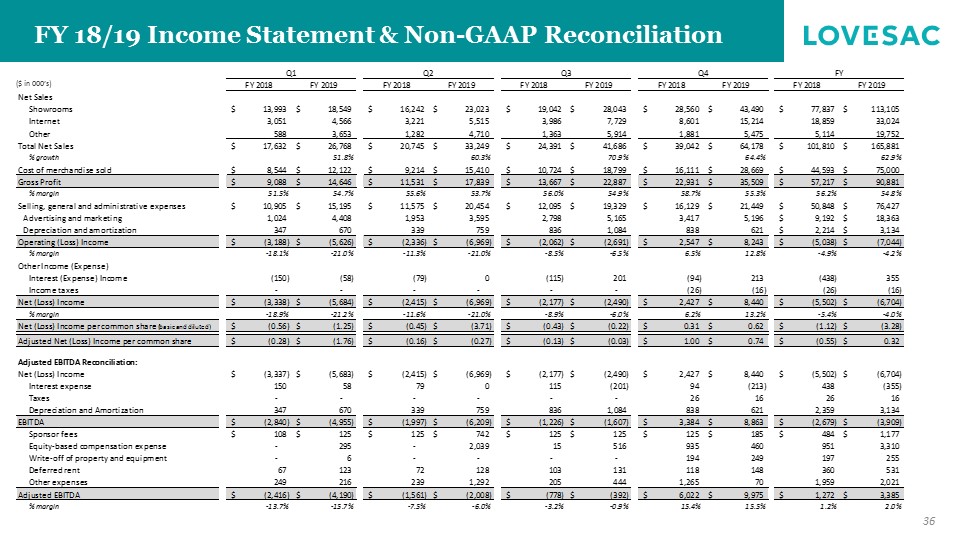
36 FY 18/19 Income Statement & Non - GAAP Reconciliation ($ in 000’s) FY 2018 FY 2019 FY 2018 FY 2019 FY 2018 FY 2019 FY 2018 FY 2019 FY 2018 FY 2019 Net Sales Showrooms 13,993$ 18,549$ 16,242$ 23,023$ 19,042$ 28,043$ 28,560$ 43,490$ 77,837$ 113,105$ Internet 3,051 4,566 3,221 5,515 3,986 7,729 8,601 15,214 18,859 33,024 Other 588 3,653 1,282 4,710 1,363 5,914 1,881 5,475 5,114 19,752 Total Net Sales 17,632$ 26,768$ 20,745$ 33,249$ 24,391$ 41,686$ 39,042$ 64,178$ 101,810$ 165,881$ % growth 51.8% 60.3% 70.9% 64.4% 62.9% Cost of merchandise sold 8,544$ 12,122$ 9,214$ 15,410$ 10,724$ 18,799$ 16,111$ 28,669$ 44,593$ 75,000$ Gross Profit 9,088$ 14,646$ 11,531$ 17,839$ 13,667$ 22,887$ 22,931$ 35,509$ 57,217$ 90,881$ % margin 51.5% 54.7% 55.6% 53.7% 56.0% 54.9% 58.7% 55.3% 56.2% 54.8% Selling, general and administrative expenses 10,905$ 15,195$ 11,575$ 20,454$ 12,095$ 19,329$ 16,129$ 21,449$ 50,848$ 76,427$ Advertising and marketing 1,024 4,408 1,953 3,595 2,798 5,165 3,417 5,196 9,192$ 18,363$ Depreciation and amortization 347 670 339 759 836 1,084 838 621 2,214$ 3,134$ Operating (Loss) Income (3,188)$ (5,626)$ (2,336)$ (6,969)$ (2,062)$ (2,691)$ 2,547$ 8,243$ (5,038)$ (7,044)$ % margin -18.1% -21.0% -11.3% -21.0% -8.5% -6.5% 6.5% 12.8% -4.9% -4.2% Other Income (Expense) Interest (Expense) Income (150) (58) (79) 0 (115) 201 (94) 213 (438) 355 Income taxes - - - - - - (26) (16) (26) (16) Net (Loss) Income (3,338)$ (5,684)$ (2,415)$ (6,969)$ (2,177)$ (2,490)$ 2,427$ 8,440$ (5,502)$ (6,704)$ % margin -18.9% -21.2% -11.6% -21.0% -8.9% -6.0% 6.2% 13.2% -5.4% -4.0% Net (Loss) Income per common share (basic and diluted) (0.56)$ (1.25)$ (0.45)$ (3.71)$ (0.43)$ (0.22)$ 0.31$ 0.62$ (1.12)$ (3.28)$ Adjusted Net (Loss) Income per common share (0.28)$ (1.76)$ (0.16)$ (0.27)$ (0.13)$ (0.03)$ 1.00$ 0.74$ (0.55)$ 0.32$ Adjusted EBITDA Reconciliation: Net (Loss) Income (3,337)$ (5,683)$ (2,415)$ (6,969)$ (2,177)$ (2,490)$ 2,427$ 8,440$ (5,502)$ (6,704)$ Interest expense 150 58 79 0 115 (201) 94 (213) 438 (355) Taxes - - - - - - 26 16 26 16 Depreciation and Amortization 347 670 339 759 836 1,084 838 621 2,359 3,134 EBITDA (2,840)$ (4,955)$ (1,997)$ (6,209)$ (1,226)$ (1,607)$ 3,384$ 8,863$ (2,679)$ (3,909)$ Sponsor fees 108$ 125$ 125$ 742$ 125$ 125$ 125$ 185$ 484$ 1,177$ Equity-based compensation expense - 295 - 2,039 15 516 935 460 951 3,310 Write-off of property and equipment - 6 - - - - 194 249 197 255 Deferred rent 67 123 72 128 103 131 118 148 360 531 Other expenses 249 216 239 1,292 205 444 1,265 70 1,959 2,021 Adjusted EBITDA (2,416)$ (4,190)$ (1,561)$ (2,008)$ (778)$ (392)$ 6,022$ 9,975$ 1,272$ 3,385$ % margin -13.7% -15.7% -7.5% -6.0% -3.2% -0.9% 15.4% 15.5% 1.2% 2.0% FYQ4Q1 Q2 Q3